States with the Highest Percentage of Population Employed in Business & Financial
RELATED REPORTS & OPTIONS
Business & Financial
United States
Compare States
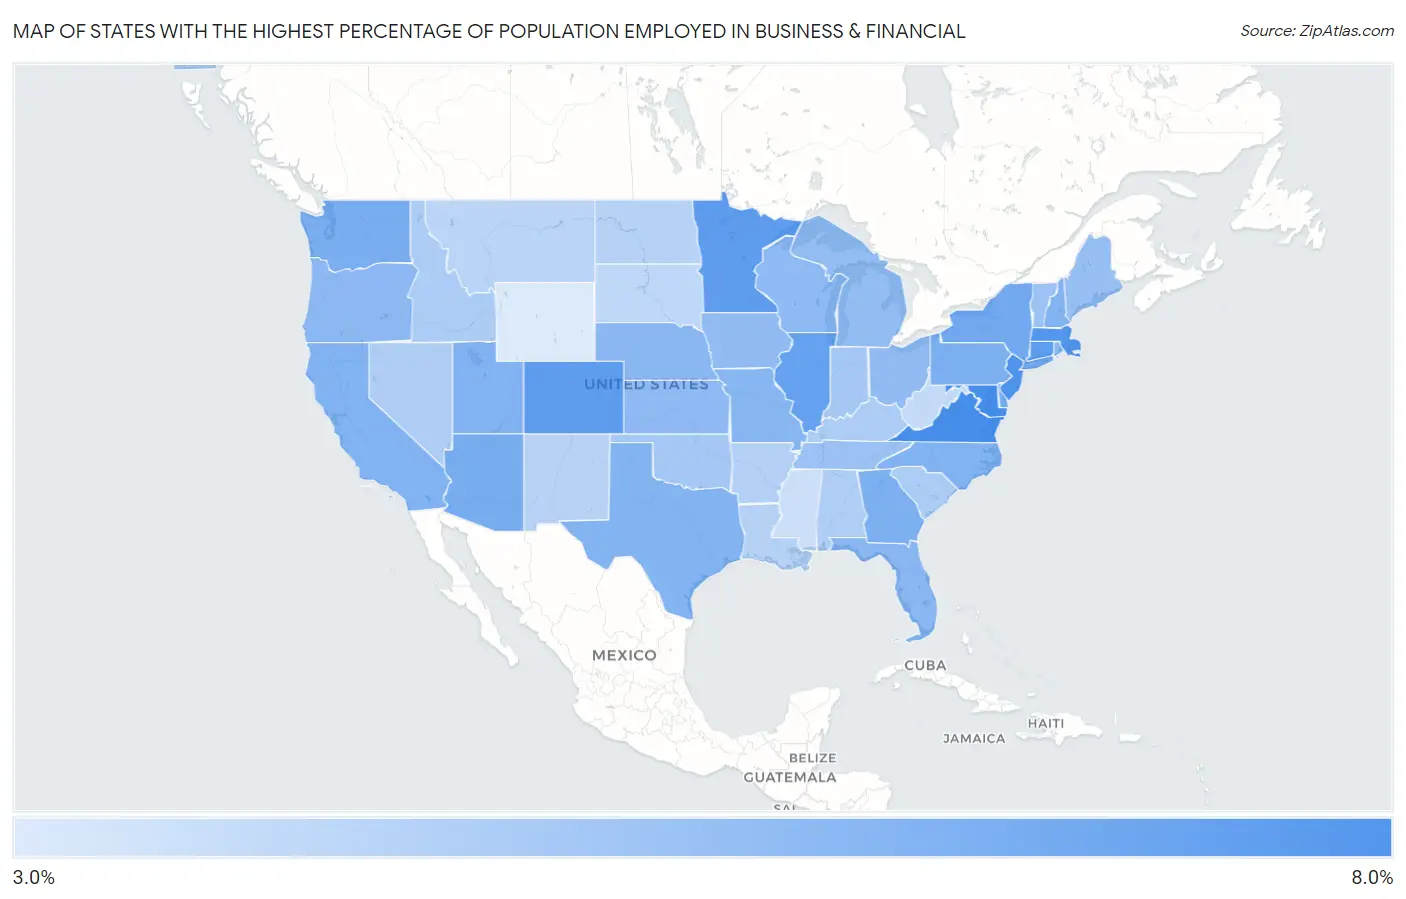
Map of States with the Highest Percentage of Population Employed in Business & Financial
3.0%
8.0%
States with the Highest Percentage of Population Employed in Business & Financial in the United States
| State | % Employed | vs State Median | vs National | |
| 1. | Virginia | 7.3% | 5.4% (+1.94) | 5.8%(+1.57) |
| 2. | Maryland | 7.3% | 5.4% (+1.91) | 5.8%(+1.55) |
| 3. | New Jersey | 7.1% | 5.4% (+1.68) | 5.8%(+1.32) |
| 4. | Massachusetts | 7.0% | 5.4% (+1.63) | 5.8%(+1.26) |
| 5. | Connecticut | 6.8% | 5.4% (+1.39) | 5.8%(+1.03) |
| 6. | Colorado | 6.7% | 5.4% (+1.29) | 5.8%(+0.922) |
| 7. | Minnesota | 6.7% | 5.4% (+1.28) | 5.8%(+0.917) |
| 8. | Illinois | 6.5% | 5.4% (+1.12) | 5.8%(+0.760) |
| 9. | New York | 6.2% | 5.4% (+0.752) | 5.8%(+0.388) |
| 10. | Delaware | 6.1% | 5.4% (+0.685) | 5.8%(+0.320) |
| 11. | Arizona | 6.0% | 5.4% (+0.639) | 5.8%(+0.275) |
| 12. | Washington | 5.9% | 5.4% (+0.541) | 5.8%(+0.177) |
| 13. | Georgia | 5.9% | 5.4% (+0.506) | 5.8%(+0.142) |
| 14. | Pennsylvania | 5.9% | 5.4% (+0.495) | 5.8%(+0.131) |
| 15. | California | 5.8% | 5.4% (+0.398) | 5.8%(+0.034) |
| 16. | Utah | 5.8% | 5.4% (+0.372) | 5.8%(+0.008) |
| 17. | New Hampshire | 5.8% | 5.4% (+0.359) | 5.8%(-0.005) |
| 18. | North Carolina | 5.7% | 5.4% (+0.350) | 5.8%(-0.014) |
| 19. | Texas | 5.7% | 5.4% (+0.303) | 5.8%(-0.062) |
| 20. | Missouri | 5.6% | 5.4% (+0.164) | 5.8%(-0.200) |
| 21. | Florida | 5.5% | 5.4% (+0.130) | 5.8%(-0.234) |
| 22. | Rhode Island | 5.5% | 5.4% (+0.116) | 5.8%(-0.248) |
| 23. | Nebraska | 5.5% | 5.4% (+0.096) | 5.8%(-0.269) |
| 24. | Oregon | 5.5% | 5.4% (+0.062) | 5.8%(-0.302) |
| 25. | Kansas | 5.4% | 5.4% (+0.019) | 5.8%(-0.345) |
| 26. | Wisconsin | 5.4% | 5.4% (-0.019) | 5.8%(-0.383) |
| 27. | Iowa | 5.4% | 5.4% (-0.036) | 5.8%(-0.400) |
| 28. | Ohio | 5.4% | 5.4% (-0.037) | 5.8%(-0.401) |
| 29. | Michigan | 5.3% | 5.4% (-0.135) | 5.8%(-0.499) |
| 30. | Maine | 5.1% | 5.4% (-0.250) | 5.8%(-0.614) |
| 31. | Vermont | 5.0% | 5.4% (-0.351) | 5.8%(-0.716) |
| 32. | Tennessee | 5.0% | 5.4% (-0.377) | 5.8%(-0.741) |
| 33. | Oklahoma | 4.8% | 5.4% (-0.621) | 5.8%(-0.985) |
| 34. | Indiana | 4.8% | 5.4% (-0.621) | 5.8%(-0.985) |
| 35. | Kentucky | 4.6% | 5.4% (-0.777) | 5.8%(-1.14) |
| 36. | Hawaii | 4.6% | 5.4% (-0.778) | 5.8%(-1.14) |
| 37. | Idaho | 4.6% | 5.4% (-0.790) | 5.8%(-1.15) |
| 38. | South Carolina | 4.6% | 5.4% (-0.829) | 5.8%(-1.19) |
| 39. | Nevada | 4.6% | 5.4% (-0.847) | 5.8%(-1.21) |
| 40. | Alaska | 4.5% | 5.4% (-0.855) | 5.8%(-1.22) |
| 41. | Alabama | 4.5% | 5.4% (-0.895) | 5.8%(-1.26) |
| 42. | Arkansas | 4.4% | 5.4% (-1.00) | 5.8%(-1.36) |
| 43. | Louisiana | 4.3% | 5.4% (-1.07) | 5.8%(-1.43) |
| 44. | North Dakota | 4.3% | 5.4% (-1.07) | 5.8%(-1.44) |
| 45. | New Mexico | 4.3% | 5.4% (-1.13) | 5.8%(-1.49) |
| 46. | Montana | 4.2% | 5.4% (-1.19) | 5.8%(-1.55) |
| 47. | South Dakota | 4.1% | 5.4% (-1.28) | 5.8%(-1.64) |
| 48. | West Virginia | 4.0% | 5.4% (-1.44) | 5.8%(-1.80) |
| 49. | Mississippi | 3.7% | 5.4% (-1.66) | 5.8%(-2.02) |
| 50. | Wyoming | 3.3% | 5.4% (-2.09) | 5.8%(-2.45) |
1
Common Questions
What are the Top 10 States with the Highest Percentage of Population Employed in Business & Financial in the United States?
Top 10 States with the Highest Percentage of Population Employed in Business & Financial in the United States are:
#1
7.3%
#2
7.3%
#3
7.1%
#4
7.0%
#5
6.8%
#6
6.7%
#7
6.7%
#8
6.5%
#9
6.2%
#10
6.1%
What state has the Highest Percentage of Population Employed in Business & Financial in the United States?
Virginia has the Highest Percentage of Population Employed in Business & Financial in the United States with 7.3%.
What is the Percentage of Population Employed in Business & Financial in the United States?
Percentage of Population Employed in Business & Financial in the United States is 5.8%.