Cities with the Highest Percentage of Population Employed in Business & Financial in Nevada
RELATED REPORTS & OPTIONS
Business & Financial
Nevada
Compare Cities
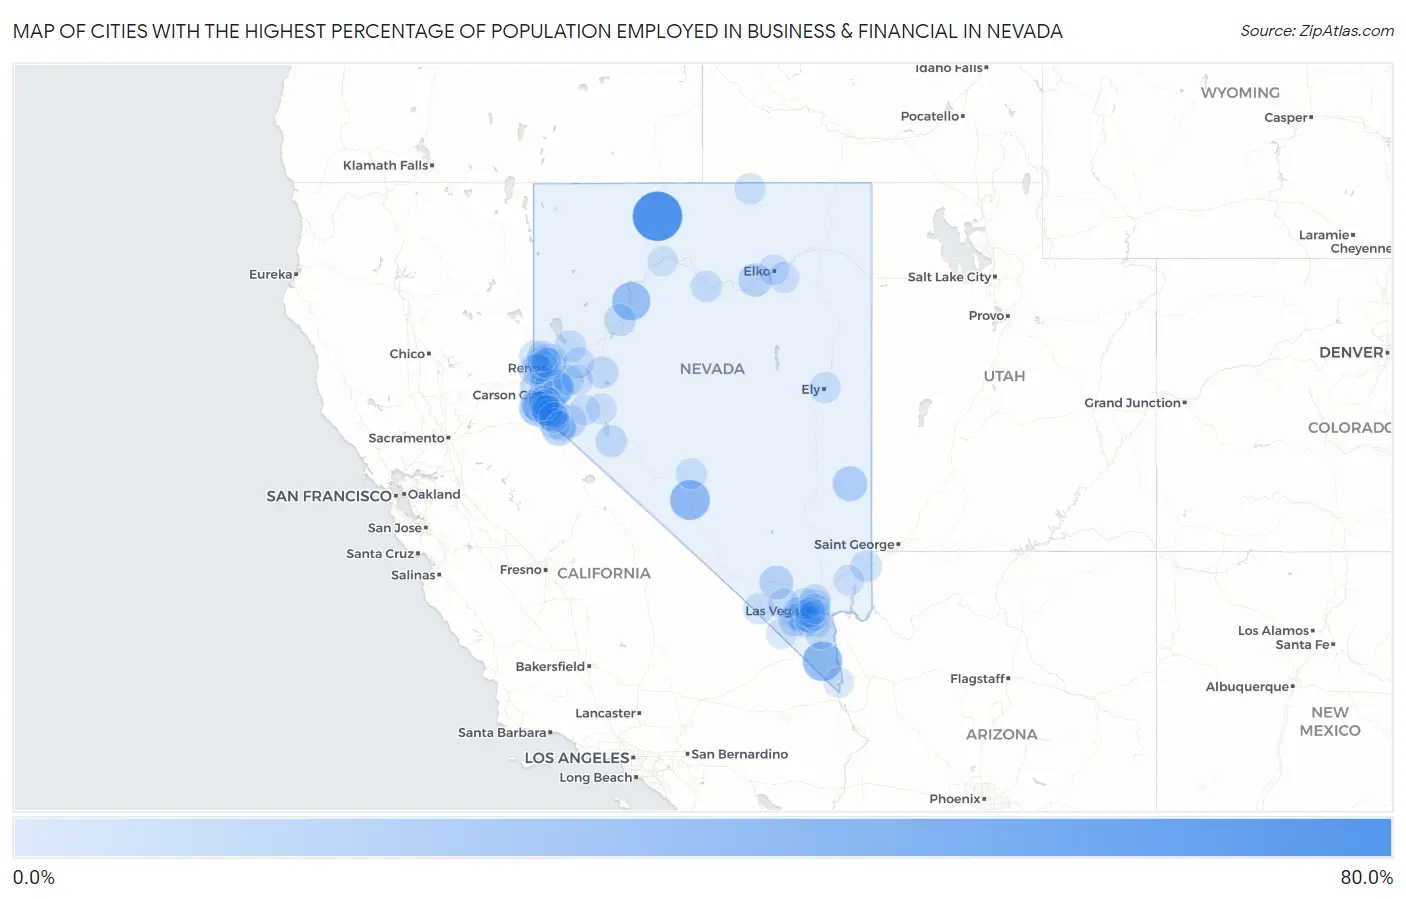
Map of Cities with the Highest Percentage of Population Employed in Business & Financial in Nevada
0.0%
80.0%
Cities with the Highest Percentage of Population Employed in Business & Financial in Nevada
| City | % Employed | vs State | vs National | |
| 1. | Orovada | 66.7% | 4.6%(+62.1)#1 | 5.8%(+60.9)#29 |
| 2. | Goldfield | 32.5% | 4.6%(+27.9)#2 | 5.8%(+26.7)#144 |
| 3. | Searchlight | 31.3% | 4.6%(+26.8)#3 | 5.8%(+25.6)#155 |
| 4. | Humboldt River Ranch | 26.9% | 4.6%(+22.4)#4 | 5.8%(+21.2)#211 |
| 5. | Silver City | 25.7% | 4.6%(+21.2)#5 | 5.8%(+20.0)#231 |
| 6. | Round Hill Village | 22.3% | 4.6%(+17.8)#6 | 5.8%(+16.5)#310 |
| 7. | Pioche | 15.4% | 4.6%(+10.8)#7 | 5.8%(+9.62)#746 |
| 8. | East Valley | 13.2% | 4.6%(+8.68)#8 | 5.8%(+7.47)#1,132 |
| 9. | Topaz Lake | 12.9% | 4.6%(+8.31)#9 | 5.8%(+7.09)#1,234 |
| 10. | Indian Springs | 12.1% | 4.6%(+7.58)#10 | 5.8%(+6.37)#1,440 |
| 11. | Carlin | 11.0% | 4.6%(+6.42)#11 | 5.8%(+5.21)#1,925 |
| 12. | Summerlin South | 9.6% | 4.6%(+5.02)#12 | 5.8%(+3.81)#2,714 |
| 13. | Smith Valley | 9.0% | 4.6%(+4.41)#13 | 5.8%(+3.20)#3,208 |
| 14. | Incline Village | 8.5% | 4.6%(+3.98)#14 | 5.8%(+2.77)#3,612 |
| 15. | Washoe Valley | 8.1% | 4.6%(+3.55)#15 | 5.8%(+2.34)#4,048 |
| 16. | Golden Valley | 8.1% | 4.6%(+3.54)#16 | 5.8%(+2.33)#4,066 |
| 17. | Blue Diamond | 7.6% | 4.6%(+3.09)#17 | 5.8%(+1.88)#4,637 |
| 18. | Skyland | 7.6% | 4.6%(+3.01)#18 | 5.8%(+1.80)#4,710 |
| 19. | Lovelock | 6.8% | 4.6%(+2.30)#19 | 5.8%(+1.09)#5,665 |
| 20. | Johnson Lane | 6.7% | 4.6%(+2.19)#20 | 5.8%(+0.983)#5,847 |
| 21. | Amargosa Valley | 6.4% | 4.6%(+1.85)#21 | 5.8%(+0.640)#6,400 |
| 22. | Fallon | 6.2% | 4.6%(+1.64)#22 | 5.8%(+0.426)#6,757 |
| 23. | Kingsbury | 6.2% | 4.6%(+1.63)#23 | 5.8%(+0.418)#6,772 |
| 24. | Fish Springs | 6.1% | 4.6%(+1.58)#24 | 5.8%(+0.369)#6,861 |
| 25. | Hawthorne | 6.1% | 4.6%(+1.54)#25 | 5.8%(+0.325)#6,952 |
| 26. | Henderson | 6.0% | 4.6%(+1.40)#26 | 5.8%(+0.193)#7,213 |
| 27. | Carson | 5.7% | 4.6%(+1.16)#27 | 5.8%(-0.053)#7,699 |
| 28. | Verdi | 5.5% | 4.6%(+0.984)#28 | 5.8%(-0.228)#8,062 |
| 29. | Dayton | 5.5% | 4.6%(+0.928)#29 | 5.8%(-0.283)#8,189 |
| 30. | Spanish Springs | 5.3% | 4.6%(+0.726)#30 | 5.8%(-0.485)#8,625 |
| 31. | Nixon | 5.2% | 4.6%(+0.643)#31 | 5.8%(-0.568)#8,822 |
| 32. | Spring Valley | 5.1% | 4.6%(+0.578)#32 | 5.8%(-0.633)#8,966 |
| 33. | Enterprise | 5.0% | 4.6%(+0.495)#33 | 5.8%(-0.716)#9,149 |
| 34. | Gardnerville Ranchos | 4.9% | 4.6%(+0.357)#34 | 5.8%(-0.854)#9,449 |
| 35. | Sparks | 4.9% | 4.6%(+0.354)#35 | 5.8%(-0.857)#9,459 |
| 36. | Ruhenstroth | 4.9% | 4.6%(+0.346)#36 | 5.8%(-0.866)#9,483 |
| 37. | Nellis Afb | 4.9% | 4.6%(+0.341)#37 | 5.8%(-0.871)#9,498 |
| 38. | Mesquite | 4.8% | 4.6%(+0.235)#38 | 5.8%(-0.976)#9,737 |
| 39. | Reno | 4.8% | 4.6%(+0.200)#39 | 5.8%(-1.01)#9,817 |
| 40. | Cold Springs | 4.6% | 4.6%(+0.067)#40 | 5.8%(-1.14)#10,138 |
| 41. | Las Vegas | 4.6% | 4.6%(+0.028)#41 | 5.8%(-1.18)#10,232 |
| 42. | Gardnerville | 4.6% | 4.6%(+0.005)#42 | 5.8%(-1.21)#10,283 |
| 43. | Indian Hills | 4.5% | 4.6%(-0.055)#43 | 5.8%(-1.27)#10,441 |
| 44. | Battle Mountain | 4.2% | 4.6%(-0.382)#44 | 5.8%(-1.59)#11,318 |
| 45. | Boulder City | 4.2% | 4.6%(-0.400)#45 | 5.8%(-1.61)#11,372 |
| 46. | Paradise | 4.1% | 4.6%(-0.403)#46 | 5.8%(-1.61)#11,377 |
| 47. | Double Spring | 4.0% | 4.6%(-0.551)#47 | 5.8%(-1.76)#11,740 |
| 48. | North Las Vegas | 3.9% | 4.6%(-0.663)#48 | 5.8%(-1.87)#12,045 |
| 49. | Ely | 3.8% | 4.6%(-0.783)#49 | 5.8%(-1.99)#12,395 |
| 50. | Pahrump | 3.5% | 4.6%(-1.08)#50 | 5.8%(-2.29)#13,235 |
| 51. | Fernley | 3.5% | 4.6%(-1.10)#51 | 5.8%(-2.31)#13,306 |
| 52. | Tonopah | 3.4% | 4.6%(-1.17)#52 | 5.8%(-2.38)#13,514 |
| 53. | Zephyr Cove | 3.3% | 4.6%(-1.30)#53 | 5.8%(-2.51)#13,873 |
| 54. | Mount Charleston | 3.2% | 4.6%(-1.31)#54 | 5.8%(-2.52)#13,893 |
| 55. | Genoa | 3.0% | 4.6%(-1.54)#55 | 5.8%(-2.75)#14,641 |
| 56. | Silver Springs | 3.0% | 4.6%(-1.58)#56 | 5.8%(-2.79)#14,763 |
| 57. | Minden | 3.0% | 4.6%(-1.58)#57 | 5.8%(-2.80)#14,784 |
| 58. | Whitney | 2.9% | 4.6%(-1.64)#58 | 5.8%(-2.85)#14,965 |
| 59. | Mogul | 2.9% | 4.6%(-1.66)#59 | 5.8%(-2.87)#15,026 |
| 60. | Owyhee | 2.8% | 4.6%(-1.75)#60 | 5.8%(-2.96)#15,317 |
| 61. | Spring Creek | 2.7% | 4.6%(-1.85)#61 | 5.8%(-3.06)#15,655 |
| 62. | Schurz | 2.6% | 4.6%(-1.95)#62 | 5.8%(-3.17)#15,949 |
| 63. | Lemmon Valley | 2.4% | 4.6%(-2.20)#63 | 5.8%(-3.41)#16,751 |
| 64. | Topaz Ranch Estates | 2.3% | 4.6%(-2.25)#64 | 5.8%(-3.46)#16,902 |
| 65. | Elko | 2.2% | 4.6%(-2.30)#65 | 5.8%(-3.52)#17,096 |
| 66. | Yerington | 2.2% | 4.6%(-2.38)#66 | 5.8%(-3.59)#17,344 |
| 67. | Winchester | 2.1% | 4.6%(-2.48)#67 | 5.8%(-3.69)#17,684 |
| 68. | Sunrise Manor | 2.0% | 4.6%(-2.53)#68 | 5.8%(-3.75)#17,836 |
| 69. | Moapa Valley | 1.9% | 4.6%(-2.61)#69 | 5.8%(-3.82)#18,068 |
| 70. | Sun Valley | 1.9% | 4.6%(-2.64)#70 | 5.8%(-3.85)#18,164 |
| 71. | Carter Springs | 1.8% | 4.6%(-2.71)#71 | 5.8%(-3.92)#18,401 |
| 72. | Sandy Valley | 1.4% | 4.6%(-3.11)#72 | 5.8%(-4.32)#19,646 |
| 73. | Winnemucca | 1.2% | 4.6%(-3.40)#73 | 5.8%(-4.61)#20,468 |
| 74. | Laughlin | 1.1% | 4.6%(-3.45)#74 | 5.8%(-4.67)#20,639 |
| 75. | Stagecoach | 1.1% | 4.6%(-3.47)#75 | 5.8%(-4.68)#20,688 |
1
2Common Questions
What are the Top 10 Cities with the Highest Percentage of Population Employed in Business & Financial in Nevada?
Top 10 Cities with the Highest Percentage of Population Employed in Business & Financial in Nevada are:
#1
66.7%
#2
32.5%
#3
31.3%
#4
26.9%
#5
25.7%
#6
22.3%
#7
15.4%
#8
13.2%
#9
12.9%
#10
12.1%
What city has the Highest Percentage of Population Employed in Business & Financial in Nevada?
Orovada has the Highest Percentage of Population Employed in Business & Financial in Nevada with 66.7%.
What is the Percentage of Population Employed in Business & Financial in the State of Nevada?
Percentage of Population Employed in Business & Financial in Nevada is 4.6%.
What is the Percentage of Population Employed in Business & Financial in the United States?
Percentage of Population Employed in Business & Financial in the United States is 5.8%.