Cities with the Highest Percentage of Population Employed in Business & Financial in Tennessee
RELATED REPORTS & OPTIONS
Business & Financial
Tennessee
Compare Cities
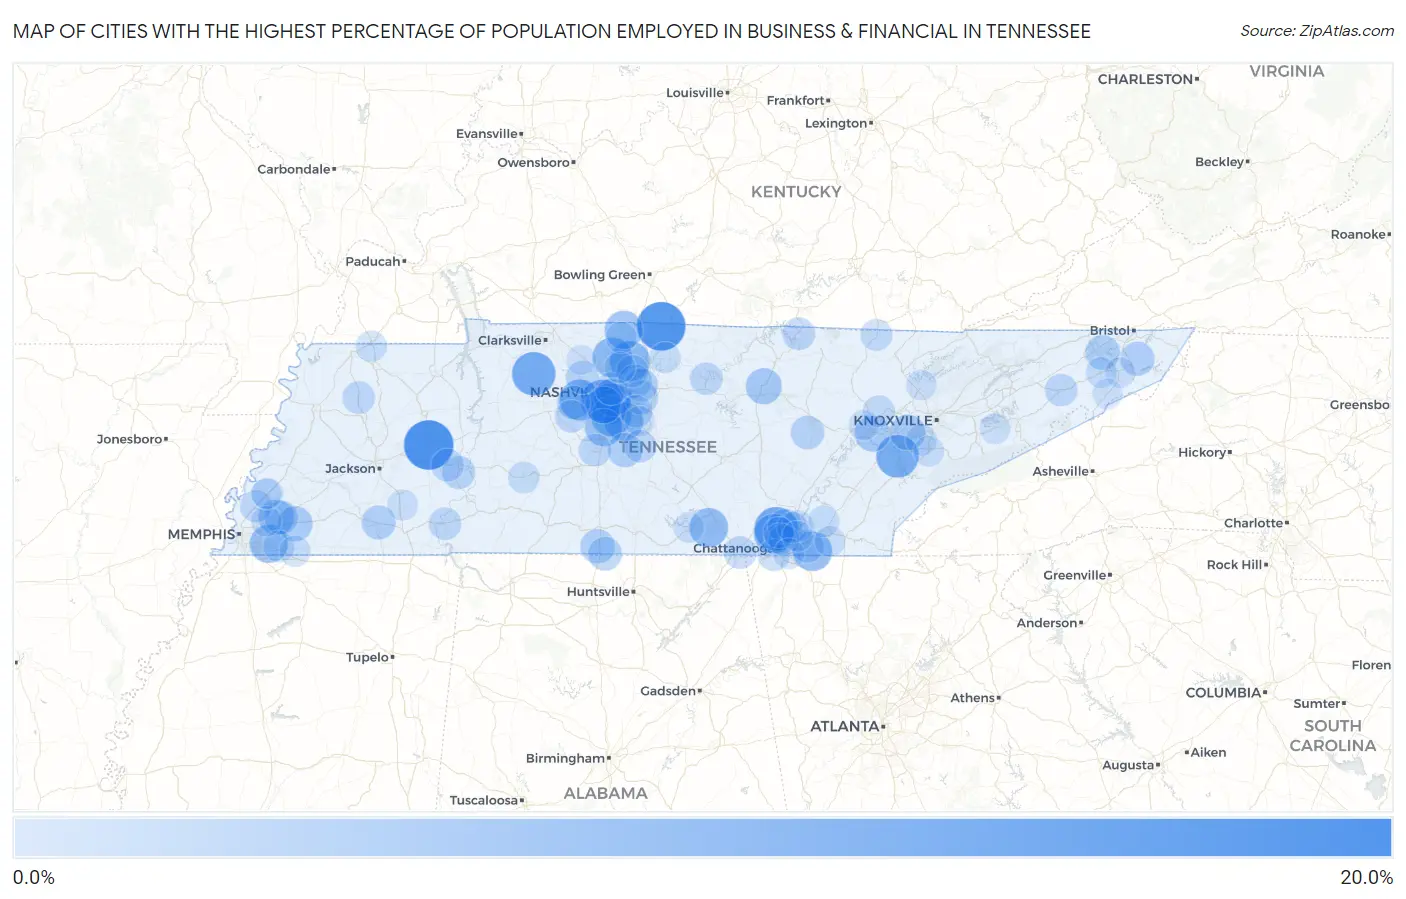
Map of Cities with the Highest Percentage of Population Employed in Business & Financial in Tennessee
0.0%
20.0%
Cities with the Highest Percentage of Population Employed in Business & Financial in Tennessee
| City | % Employed | vs State | vs National | |
| 1. | Parker S Crossroads | 19.3% | 5.0%(+14.2)#1 | 5.8%(+13.5)#428 |
| 2. | Fairfield | 18.5% | 5.0%(+13.5)#2 | 5.8%(+12.7)#473 |
| 3. | Walnut Grove Cdp Sumner County | 15.6% | 5.0%(+10.6)#3 | 5.8%(+9.86)#703 |
| 4. | Cosby | 15.3% | 5.0%(+10.3)#4 | 5.8%(+9.54)#768 |
| 5. | Fairmount | 15.0% | 5.0%(+9.95)#5 | 5.8%(+9.21)#806 |
| 6. | Slayden | 14.9% | 5.0%(+9.84)#6 | 5.8%(+9.10)#821 |
| 7. | Belle Meade | 14.5% | 5.0%(+9.47)#7 | 5.8%(+8.73)#876 |
| 8. | Tellico Village | 14.2% | 5.0%(+9.18)#8 | 5.8%(+8.44)#929 |
| 9. | Oak Grove Cdp Sumner County | 13.5% | 5.0%(+8.49)#9 | 5.8%(+7.75)#1,055 |
| 10. | Oak Hill | 13.1% | 5.0%(+8.09)#10 | 5.8%(+7.35)#1,168 |
| 11. | Pegram | 13.1% | 5.0%(+8.04)#11 | 5.8%(+7.30)#1,181 |
| 12. | Shackle Island | 12.5% | 5.0%(+7.50)#12 | 5.8%(+6.76)#1,315 |
| 13. | Ridgetop | 12.4% | 5.0%(+7.40)#13 | 5.8%(+6.66)#1,352 |
| 14. | Brentwood | 12.2% | 5.0%(+7.23)#14 | 5.8%(+6.49)#1,395 |
| 15. | Signal Mountain | 12.1% | 5.0%(+7.08)#15 | 5.8%(+6.34)#1,453 |
| 16. | Apison | 11.9% | 5.0%(+6.86)#16 | 5.8%(+6.12)#1,528 |
| 17. | Nolensville | 11.7% | 5.0%(+6.64)#17 | 5.8%(+5.90)#1,623 |
| 18. | Sewanee | 11.5% | 5.0%(+6.44)#18 | 5.8%(+5.70)#1,702 |
| 19. | Germantown | 11.1% | 5.0%(+6.05)#19 | 5.8%(+5.31)#1,873 |
| 20. | Orlinda | 11.1% | 5.0%(+6.03)#20 | 5.8%(+5.29)#1,882 |
| 21. | Berry Hill | 11.0% | 5.0%(+5.95)#21 | 5.8%(+5.21)#1,922 |
| 22. | Sullivan Gardens | 10.8% | 5.0%(+5.80)#22 | 5.8%(+5.06)#1,984 |
| 23. | Franklin | 10.7% | 5.0%(+5.72)#23 | 5.8%(+4.98)#2,028 |
| 24. | Forest Hills | 10.3% | 5.0%(+5.32)#24 | 5.8%(+4.58)#2,228 |
| 25. | Algood | 9.5% | 5.0%(+4.48)#25 | 5.8%(+3.74)#2,742 |
| 26. | Lakeland | 9.3% | 5.0%(+4.27)#26 | 5.8%(+3.53)#2,935 |
| 27. | Kingston | 9.2% | 5.0%(+4.23)#27 | 5.8%(+3.48)#2,975 |
| 28. | Farragut | 9.2% | 5.0%(+4.20)#28 | 5.8%(+3.46)#2,989 |
| 29. | Beech Bluff | 9.1% | 5.0%(+4.12)#29 | 5.8%(+3.37)#3,058 |
| 30. | Oakland | 8.9% | 5.0%(+3.87)#30 | 5.8%(+3.13)#3,274 |
| 31. | Karns | 8.7% | 5.0%(+3.70)#31 | 5.8%(+2.96)#3,434 |
| 32. | Spurgeon | 8.6% | 5.0%(+3.62)#32 | 5.8%(+2.88)#3,514 |
| 33. | Eagleville | 8.6% | 5.0%(+3.55)#33 | 5.8%(+2.81)#3,574 |
| 34. | Falling Water | 8.4% | 5.0%(+3.41)#34 | 5.8%(+2.67)#3,706 |
| 35. | Elkton | 8.3% | 5.0%(+3.31)#35 | 5.8%(+2.57)#3,806 |
| 36. | Hunter | 8.2% | 5.0%(+3.18)#36 | 5.8%(+2.44)#3,938 |
| 37. | Hornsby | 8.2% | 5.0%(+3.18)#37 | 5.8%(+2.43)#3,942 |
| 38. | Rural Hill | 8.1% | 5.0%(+3.05)#38 | 5.8%(+2.31)#4,088 |
| 39. | Ardmore | 8.0% | 5.0%(+3.02)#39 | 5.8%(+2.27)#4,134 |
| 40. | Arlington | 7.9% | 5.0%(+2.93)#40 | 5.8%(+2.19)#4,226 |
| 41. | Rarity Bay | 7.9% | 5.0%(+2.89)#41 | 5.8%(+2.15)#4,292 |
| 42. | Kingston Springs | 7.8% | 5.0%(+2.79)#42 | 5.8%(+2.05)#4,407 |
| 43. | Lake Tansi | 7.8% | 5.0%(+2.76)#43 | 5.8%(+2.02)#4,451 |
| 44. | Green Hill | 7.8% | 5.0%(+2.75)#44 | 5.8%(+2.01)#4,458 |
| 45. | Mount Juliet | 7.8% | 5.0%(+2.75)#45 | 5.8%(+2.01)#4,465 |
| 46. | Decaturville | 7.5% | 5.0%(+2.53)#46 | 5.8%(+1.78)#4,732 |
| 47. | Ashland City | 7.4% | 5.0%(+2.42)#47 | 5.8%(+1.68)#4,859 |
| 48. | Darden | 7.3% | 5.0%(+2.31)#48 | 5.8%(+1.57)#4,975 |
| 49. | Collegedale | 7.3% | 5.0%(+2.29)#49 | 5.8%(+1.55)#5,022 |
| 50. | Byrdstown | 7.2% | 5.0%(+2.18)#50 | 5.8%(+1.44)#5,180 |
| 51. | Spring Hill | 7.2% | 5.0%(+2.17)#51 | 5.8%(+1.43)#5,190 |
| 52. | Nashville | 7.2% | 5.0%(+2.16)#52 | 5.8%(+1.42)#5,194 |
| 53. | New Hope | 7.2% | 5.0%(+2.14)#53 | 5.8%(+1.40)#5,223 |
| 54. | Rutherford | 7.1% | 5.0%(+2.12)#54 | 5.8%(+1.38)#5,242 |
| 55. | Savannah | 7.1% | 5.0%(+2.07)#55 | 5.8%(+1.33)#5,310 |
| 56. | Fairview | 7.1% | 5.0%(+2.06)#56 | 5.8%(+1.32)#5,328 |
| 57. | Carthage | 7.1% | 5.0%(+2.05)#57 | 5.8%(+1.31)#5,335 |
| 58. | Rockvale | 7.0% | 5.0%(+2.00)#58 | 5.8%(+1.26)#5,408 |
| 59. | Greeneville | 7.0% | 5.0%(+1.98)#59 | 5.8%(+1.24)#5,444 |
| 60. | La Vergne | 6.9% | 5.0%(+1.91)#60 | 5.8%(+1.17)#5,546 |
| 61. | Hendersonville | 6.9% | 5.0%(+1.89)#61 | 5.8%(+1.15)#5,584 |
| 62. | Millington | 6.8% | 5.0%(+1.76)#62 | 5.8%(+1.02)#5,774 |
| 63. | Lookout Mountain | 6.7% | 5.0%(+1.72)#63 | 5.8%(+0.980)#5,855 |
| 64. | Coalfield | 6.6% | 5.0%(+1.60)#64 | 5.8%(+0.858)#6,060 |
| 65. | Winfield | 6.6% | 5.0%(+1.59)#65 | 5.8%(+0.854)#6,069 |
| 66. | Lakesite | 6.6% | 5.0%(+1.57)#66 | 5.8%(+0.832)#6,095 |
| 67. | Atoka | 6.5% | 5.0%(+1.45)#67 | 5.8%(+0.712)#6,280 |
| 68. | Mayland | 6.5% | 5.0%(+1.45)#68 | 5.8%(+0.712)#6,284 |
| 69. | Hohenwald | 6.4% | 5.0%(+1.42)#69 | 5.8%(+0.682)#6,335 |
| 70. | Collierville | 6.4% | 5.0%(+1.33)#70 | 5.8%(+0.591)#6,476 |
| 71. | Hopewell | 6.3% | 5.0%(+1.24)#71 | 5.8%(+0.502)#6,607 |
| 72. | Cross Plains | 6.2% | 5.0%(+1.22)#72 | 5.8%(+0.481)#6,663 |
| 73. | Finley | 6.2% | 5.0%(+1.21)#73 | 5.8%(+0.468)#6,685 |
| 74. | Chattanooga | 6.2% | 5.0%(+1.20)#74 | 5.8%(+0.458)#6,691 |
| 75. | Red Bank | 6.2% | 5.0%(+1.17)#75 | 5.8%(+0.427)#6,756 |
| 76. | Goodlettsville | 6.2% | 5.0%(+1.16)#76 | 5.8%(+0.422)#6,768 |
| 77. | Rossville | 6.2% | 5.0%(+1.15)#77 | 5.8%(+0.410)#6,786 |
| 78. | South Fulton | 6.1% | 5.0%(+1.10)#78 | 5.8%(+0.362)#6,878 |
| 79. | Louisville | 6.1% | 5.0%(+1.08)#79 | 5.8%(+0.342)#6,919 |
| 80. | Jonesborough | 6.1% | 5.0%(+1.05)#80 | 5.8%(+0.310)#6,983 |
| 81. | Middle Valley | 6.1% | 5.0%(+1.05)#81 | 5.8%(+0.308)#6,986 |
| 82. | Castalian Springs | 6.1% | 5.0%(+1.05)#82 | 5.8%(+0.307)#6,989 |
| 83. | Walden | 6.0% | 5.0%(+0.969)#83 | 5.8%(+0.228)#7,138 |
| 84. | Finger | 6.0% | 5.0%(+0.939)#84 | 5.8%(+0.198)#7,197 |
| 85. | Maryville | 6.0% | 5.0%(+0.934)#85 | 5.8%(+0.193)#7,212 |
| 86. | Wildwood Lake | 5.9% | 5.0%(+0.883)#86 | 5.8%(+0.142)#7,317 |
| 87. | East Ridge | 5.9% | 5.0%(+0.883)#87 | 5.8%(+0.142)#7,318 |
| 88. | Harrison | 5.9% | 5.0%(+0.874)#88 | 5.8%(+0.133)#7,331 |
| 89. | Winchester | 5.8% | 5.0%(+0.815)#89 | 5.8%(+0.074)#7,440 |
| 90. | Fairgarden | 5.8% | 5.0%(+0.775)#90 | 5.8%(+0.034)#7,510 |
| 91. | Harriman | 5.8% | 5.0%(+0.769)#91 | 5.8%(+0.028)#7,524 |
| 92. | John Sevier | 5.8% | 5.0%(+0.752)#92 | 5.8%(+0.011)#7,557 |
| 93. | Norris | 5.7% | 5.0%(+0.724)#93 | 5.8%(-0.017)#7,612 |
| 94. | Bartlett | 5.7% | 5.0%(+0.663)#94 | 5.8%(-0.078)#7,740 |
| 95. | Smyrna | 5.7% | 5.0%(+0.638)#95 | 5.8%(-0.103)#7,790 |
| 96. | Hampton | 5.7% | 5.0%(+0.636)#96 | 5.8%(-0.105)#7,795 |
| 97. | Pine Crest | 5.6% | 5.0%(+0.592)#97 | 5.8%(-0.149)#7,885 |
| 98. | Munford | 5.5% | 5.0%(+0.523)#98 | 5.8%(-0.218)#8,039 |
| 99. | Erwin | 5.5% | 5.0%(+0.461)#99 | 5.8%(-0.280)#8,182 |
| 100. | Pleasant View | 5.5% | 5.0%(+0.453)#100 | 5.8%(-0.288)#8,209 |
Common Questions
What are the Top 10 Cities with the Highest Percentage of Population Employed in Business & Financial in Tennessee?
Top 10 Cities with the Highest Percentage of Population Employed in Business & Financial in Tennessee are:
#1
19.3%
#2
18.5%
#3
15.0%
#4
14.9%
#5
14.5%
#6
14.2%
#7
13.1%
#8
13.1%
#9
12.5%
#10
12.4%
What city has the Highest Percentage of Population Employed in Business & Financial in Tennessee?
Parker s Crossroads has the Highest Percentage of Population Employed in Business & Financial in Tennessee with 19.3%.
What is the Percentage of Population Employed in Business & Financial in the State of Tennessee?
Percentage of Population Employed in Business & Financial in Tennessee is 5.0%.
What is the Percentage of Population Employed in Business & Financial in the United States?
Percentage of Population Employed in Business & Financial in the United States is 5.8%.