Cities with the Highest Percentage of Population Employed in Business & Financial in Connecticut
RELATED REPORTS & OPTIONS
Business & Financial
Connecticut
Compare Cities
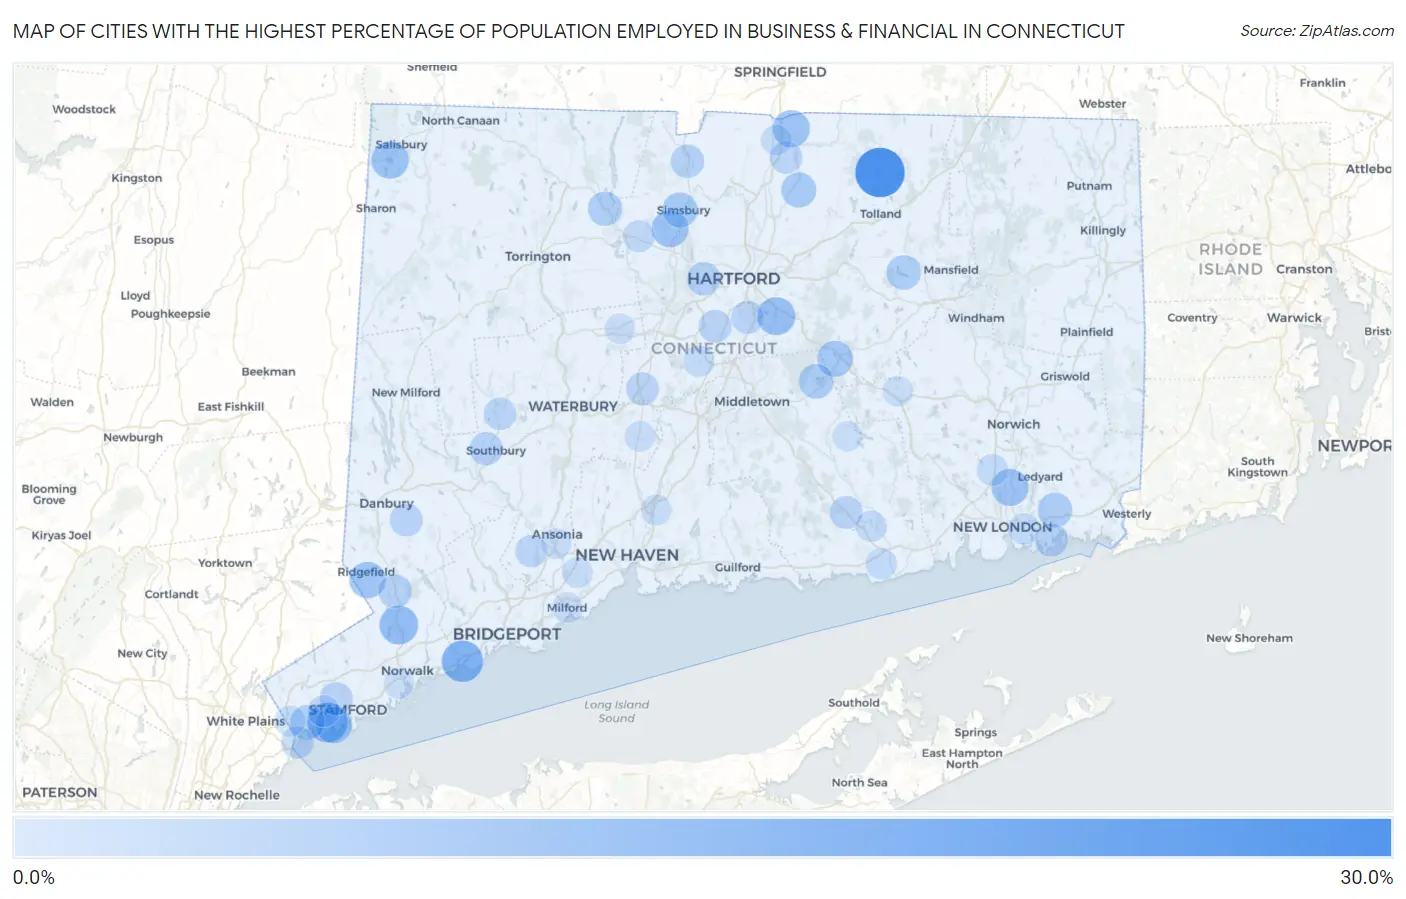
Map of Cities with the Highest Percentage of Population Employed in Business & Financial in Connecticut
0.0%
30.0%
Cities with the Highest Percentage of Population Employed in Business & Financial in Connecticut
| City | % Employed | vs State | vs National | |
| 1. | Crystal Lake | 26.9% | 6.8%(+20.2)#1 | 5.8%(+21.2)#210 |
| 2. | Witches Woods | 23.3% | 6.8%(+16.5)#2 | 5.8%(+17.6)#281 |
| 3. | Saugatuck | 22.5% | 6.8%(+15.7)#3 | 5.8%(+16.7)#306 |
| 4. | Mamanasco Lake | 20.4% | 6.8%(+13.6)#4 | 5.8%(+14.6)#372 |
| 5. | Darien Downtown | 19.6% | 6.8%(+12.8)#5 | 5.8%(+13.8)#408 |
| 6. | Westport | 19.0% | 6.8%(+12.2)#6 | 5.8%(+13.3)#445 |
| 7. | Sail Harbor | 18.9% | 6.8%(+12.1)#7 | 5.8%(+13.2)#447 |
| 8. | Southport | 18.3% | 6.8%(+11.5)#8 | 5.8%(+12.5)#481 |
| 9. | Fenwick Borough | 17.6% | 6.8%(+10.9)#9 | 5.8%(+11.9)#514 |
| 10. | Ridgebury | 17.4% | 6.8%(+10.6)#10 | 5.8%(+11.7)#526 |
| 11. | Candlewood Shores | 17.2% | 6.8%(+10.4)#11 | 5.8%(+11.4)#546 |
| 12. | Lakes West | 17.0% | 6.8%(+10.2)#12 | 5.8%(+11.3)#558 |
| 13. | Riverside | 16.8% | 6.8%(+10.0)#13 | 5.8%(+11.0)#580 |
| 14. | Redding Center | 16.2% | 6.8%(+9.40)#14 | 5.8%(+10.4)#646 |
| 15. | Coleytown | 16.1% | 6.8%(+9.30)#15 | 5.8%(+10.3)#654 |
| 16. | Compo | 15.8% | 6.8%(+9.01)#16 | 5.8%(+10.0)#683 |
| 17. | Indian Field | 15.8% | 6.8%(+8.97)#17 | 5.8%(+10.0)#688 |
| 18. | Wilton Center | 15.5% | 6.8%(+8.67)#18 | 5.8%(+9.69)#735 |
| 19. | Noroton | 15.4% | 6.8%(+8.61)#19 | 5.8%(+9.64)#742 |
| 20. | Tashua | 15.1% | 6.8%(+8.32)#20 | 5.8%(+9.35)#787 |
| 21. | South Wilton | 14.9% | 6.8%(+8.14)#21 | 5.8%(+9.17)#810 |
| 22. | Glastonbury Center | 14.7% | 6.8%(+7.95)#22 | 5.8%(+8.98)#840 |
| 23. | West Mountain | 14.7% | 6.8%(+7.88)#23 | 5.8%(+8.90)#848 |
| 24. | Old Hill | 14.7% | 6.8%(+7.87)#24 | 5.8%(+8.90)#849 |
| 25. | New Canaan | 14.6% | 6.8%(+7.81)#25 | 5.8%(+8.84)#858 |
| 26. | Lakeville | 14.1% | 6.8%(+7.35)#26 | 5.8%(+8.38)#937 |
| 27. | Sherwood Manor | 13.9% | 6.8%(+7.09)#27 | 5.8%(+8.12)#978 |
| 28. | Noroton Heights | 13.8% | 6.8%(+6.98)#28 | 5.8%(+8.01)#996 |
| 29. | Mill Plain | 13.8% | 6.8%(+6.97)#29 | 5.8%(+8.00)#997 |
| 30. | Gales Ferry | 13.8% | 6.8%(+6.97)#30 | 5.8%(+8.00)#998 |
| 31. | Weatogue | 13.7% | 6.8%(+6.89)#31 | 5.8%(+7.92)#1,010 |
| 32. | Bogus Hill | 13.7% | 6.8%(+6.89)#32 | 5.8%(+7.92)#1,011 |
| 33. | Greens Farms | 13.6% | 6.8%(+6.80)#33 | 5.8%(+7.82)#1,035 |
| 34. | Old Greenwich | 13.2% | 6.8%(+6.41)#34 | 5.8%(+7.43)#1,143 |
| 35. | Ridgefield | 13.0% | 6.8%(+6.19)#35 | 5.8%(+7.21)#1,201 |
| 36. | Route 7 Gateway | 12.9% | 6.8%(+6.15)#36 | 5.8%(+7.18)#1,216 |
| 37. | Rock Ridge | 12.9% | 6.8%(+6.11)#37 | 5.8%(+7.14)#1,225 |
| 38. | Staples | 12.8% | 6.8%(+6.04)#38 | 5.8%(+7.07)#1,244 |
| 39. | Terramuggus | 12.5% | 6.8%(+5.74)#39 | 5.8%(+6.77)#1,314 |
| 40. | Weston | 12.1% | 6.8%(+5.32)#40 | 5.8%(+6.35)#1,451 |
| 41. | Candlewood Lake Club | 11.9% | 6.8%(+5.11)#41 | 5.8%(+6.14)#1,516 |
| 42. | Hawleyville | 11.8% | 6.8%(+5.05)#42 | 5.8%(+6.08)#1,545 |
| 43. | Broad Brook | 11.7% | 6.8%(+4.95)#43 | 5.8%(+5.98)#1,583 |
| 44. | Simsbury Center | 11.7% | 6.8%(+4.94)#44 | 5.8%(+5.97)#1,588 |
| 45. | Lake Pocotopaug | 11.6% | 6.8%(+4.76)#45 | 5.8%(+5.79)#1,667 |
| 46. | East | 11.5% | 6.8%(+4.75)#46 | 5.8%(+5.78)#1,670 |
| 47. | Greenwich | 11.4% | 6.8%(+4.56)#47 | 5.8%(+5.59)#1,747 |
| 48. | Old Mystic | 11.3% | 6.8%(+4.53)#48 | 5.8%(+5.56)#1,760 |
| 49. | Tokeneke | 11.2% | 6.8%(+4.40)#49 | 5.8%(+5.43)#1,812 |
| 50. | Stepney | 11.0% | 6.8%(+4.23)#50 | 5.8%(+5.26)#1,894 |
| 51. | South Coventry | 11.0% | 6.8%(+4.22)#51 | 5.8%(+5.25)#1,896 |
| 52. | New Hartford Center | 11.0% | 6.8%(+4.21)#52 | 5.8%(+5.23)#1,909 |
| 53. | Stonington Borough | 11.0% | 6.8%(+4.19)#53 | 5.8%(+5.22)#1,919 |
| 54. | Plattsville | 10.8% | 6.8%(+4.03)#54 | 5.8%(+5.06)#1,985 |
| 55. | Murray | 10.6% | 6.8%(+3.77)#55 | 5.8%(+4.80)#2,134 |
| 56. | Georgetown | 10.2% | 6.8%(+3.43)#56 | 5.8%(+4.46)#2,304 |
| 57. | West Hartford | 10.1% | 6.8%(+3.31)#57 | 5.8%(+4.33)#2,377 |
| 58. | Salmon Brook | 10.0% | 6.8%(+3.24)#58 | 5.8%(+4.26)#2,415 |
| 59. | Heritage Village | 9.9% | 6.8%(+3.13)#59 | 5.8%(+4.16)#2,493 |
| 60. | Stamford | 9.9% | 6.8%(+3.13)#60 | 5.8%(+4.16)#2,494 |
| 61. | Noank | 9.6% | 6.8%(+2.83)#61 | 5.8%(+3.85)#2,678 |
| 62. | Newington | 9.5% | 6.8%(+2.71)#62 | 5.8%(+3.74)#2,745 |
| 63. | Knollcrest | 9.5% | 6.8%(+2.68)#63 | 5.8%(+3.71)#2,768 |
| 64. | Deep River Center | 9.4% | 6.8%(+2.65)#64 | 5.8%(+3.68)#2,804 |
| 65. | Bethel | 9.4% | 6.8%(+2.63)#65 | 5.8%(+3.66)#2,823 |
| 66. | Plantsville | 9.3% | 6.8%(+2.54)#66 | 5.8%(+3.57)#2,898 |
| 67. | Lordship | 9.3% | 6.8%(+2.50)#67 | 5.8%(+3.53)#2,930 |
| 68. | Wethersfield | 9.3% | 6.8%(+2.49)#68 | 5.8%(+3.52)#2,946 |
| 69. | Sandy Hook | 9.3% | 6.8%(+2.46)#69 | 5.8%(+3.49)#2,971 |
| 70. | Southwood Acres | 9.2% | 6.8%(+2.41)#70 | 5.8%(+3.44)#3,011 |
| 71. | Byram | 9.1% | 6.8%(+2.36)#71 | 5.8%(+3.38)#3,053 |
| 72. | Woodbury Center | 9.1% | 6.8%(+2.30)#72 | 5.8%(+3.33)#3,088 |
| 73. | Ball Pond | 8.8% | 6.8%(+2.03)#73 | 5.8%(+3.06)#3,328 |
| 74. | Shelton | 8.7% | 6.8%(+1.89)#74 | 5.8%(+2.92)#3,474 |
| 75. | Daniels Farm | 8.6% | 6.8%(+1.86)#75 | 5.8%(+2.89)#3,499 |
| 76. | Cos Cob | 8.5% | 6.8%(+1.69)#76 | 5.8%(+2.72)#3,656 |
| 77. | Canton Valley | 8.5% | 6.8%(+1.67)#77 | 5.8%(+2.69)#3,682 |
| 78. | Bantam Borough | 8.4% | 6.8%(+1.59)#78 | 5.8%(+2.62)#3,760 |
| 79. | Quasset Lake | 8.3% | 6.8%(+1.48)#79 | 5.8%(+2.51)#3,862 |
| 80. | Oxoboxo River | 8.2% | 6.8%(+1.39)#80 | 5.8%(+2.42)#3,953 |
| 81. | Lake Bungee | 8.1% | 6.8%(+1.28)#81 | 5.8%(+2.31)#4,093 |
| 82. | Woodmont Borough | 8.0% | 6.8%(+1.25)#82 | 5.8%(+2.27)#4,132 |
| 83. | Old Saybrook Center | 7.9% | 6.8%(+1.09)#83 | 5.8%(+2.12)#4,330 |
| 84. | Essex Village | 7.8% | 6.8%(+1.02)#84 | 5.8%(+2.05)#4,416 |
| 85. | Kensington | 7.8% | 6.8%(+0.969)#85 | 5.8%(+2.00)#4,477 |
| 86. | Trumbull Center | 7.7% | 6.8%(+0.937)#86 | 5.8%(+1.97)#4,508 |
| 87. | Long Hill | 7.6% | 6.8%(+0.843)#87 | 5.8%(+1.87)#4,643 |
| 88. | Glenville | 7.6% | 6.8%(+0.823)#88 | 5.8%(+1.85)#4,659 |
| 89. | Orange | 7.4% | 6.8%(+0.644)#89 | 5.8%(+1.67)#4,863 |
| 90. | Newtown Borough | 7.3% | 6.8%(+0.539)#90 | 5.8%(+1.57)#4,979 |
| 91. | North Haven | 7.3% | 6.8%(+0.529)#91 | 5.8%(+1.56)#4,997 |
| 92. | Thompsonville | 7.3% | 6.8%(+0.484)#92 | 5.8%(+1.51)#5,059 |
| 93. | Colchester | 7.2% | 6.8%(+0.447)#93 | 5.8%(+1.48)#5,124 |
| 94. | Cheshire Village | 7.2% | 6.8%(+0.437)#94 | 5.8%(+1.47)#5,136 |
| 95. | Derby | 7.2% | 6.8%(+0.435)#95 | 5.8%(+1.46)#5,138 |
| 96. | Milford City Balance | 7.1% | 6.8%(+0.344)#96 | 5.8%(+1.37)#5,275 |
| 97. | Bristol | 7.0% | 6.8%(+0.190)#97 | 5.8%(+1.22)#5,476 |
| 98. | Candlewood Knolls | 6.9% | 6.8%(+0.153)#98 | 5.8%(+1.18)#5,534 |
| 99. | Moodus | 6.9% | 6.8%(+0.108)#99 | 5.8%(+1.14)#5,592 |
| 100. | Norwalk | 6.7% | 6.8%(-0.046)#100 | 5.8%(+0.983)#5,846 |
Common Questions
What are the Top 10 Cities with the Highest Percentage of Population Employed in Business & Financial in Connecticut?
Top 10 Cities with the Highest Percentage of Population Employed in Business & Financial in Connecticut are:
#1
26.9%
#2
18.3%
#3
16.8%
#4
15.5%
#5
14.7%
#6
14.1%
#7
13.9%
#8
13.8%
#9
13.7%
#10
13.2%
What city has the Highest Percentage of Population Employed in Business & Financial in Connecticut?
Crystal Lake has the Highest Percentage of Population Employed in Business & Financial in Connecticut with 26.9%.
What is the Percentage of Population Employed in Business & Financial in the State of Connecticut?
Percentage of Population Employed in Business & Financial in Connecticut is 6.8%.
What is the Percentage of Population Employed in Business & Financial in the United States?
Percentage of Population Employed in Business & Financial in the United States is 5.8%.