Cities with the Highest Percentage of Population Employed in Business & Financial in Illinois
RELATED REPORTS & OPTIONS
Business & Financial
Illinois
Compare Cities
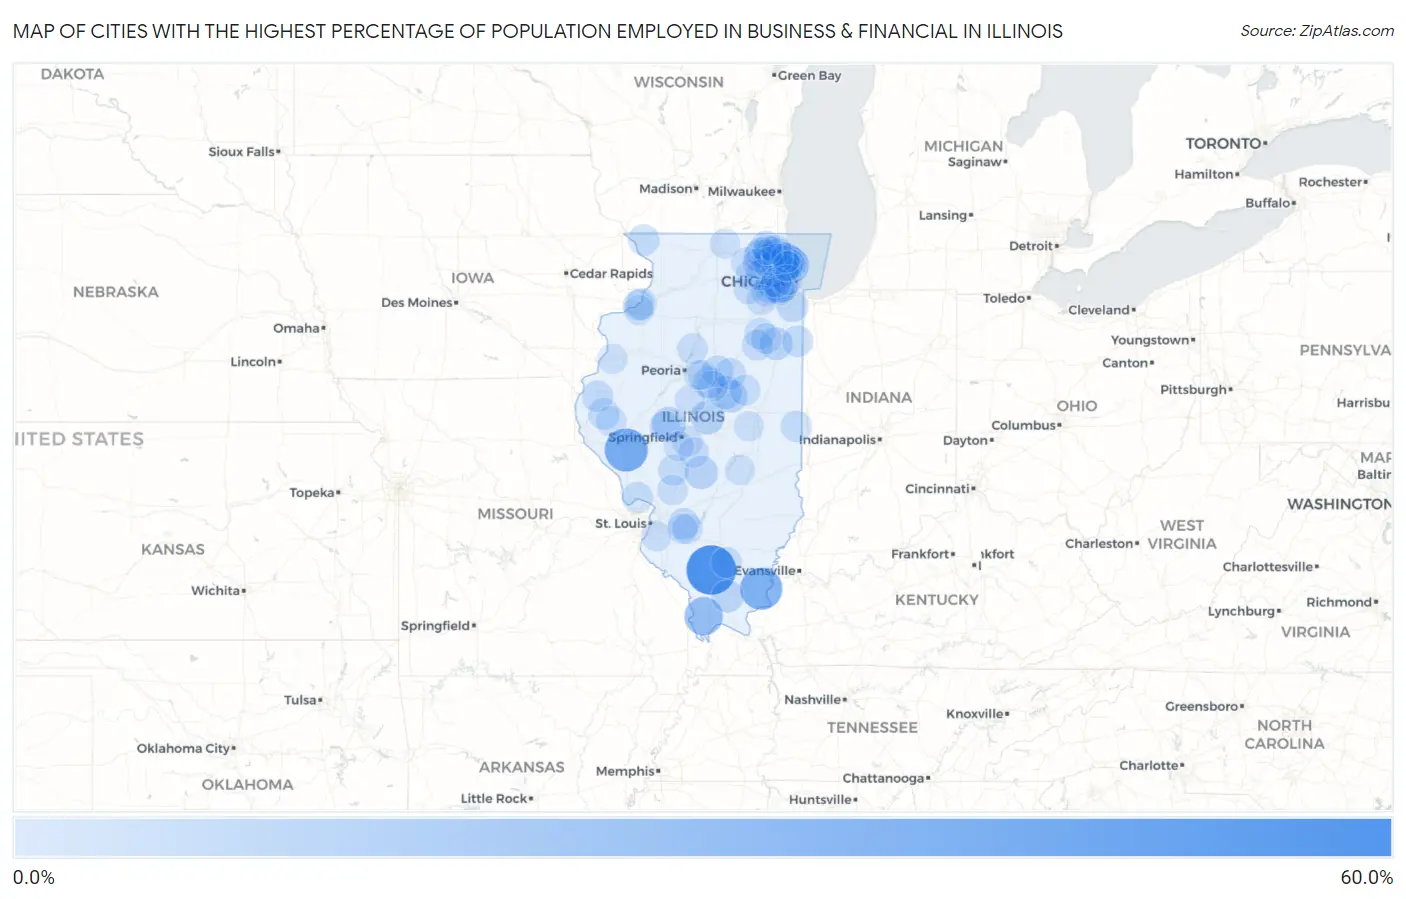
Map of Cities with the Highest Percentage of Population Employed in Business & Financial in Illinois
0.0%
60.0%
Cities with the Highest Percentage of Population Employed in Business & Financial in Illinois
| City | % Employed | vs State | vs National | |
| 1. | Mulkeytown | 55.6% | 6.5%(+49.0)#1 | 5.8%(+49.8)#43 |
| 2. | Janesville | 42.9% | 6.5%(+36.3)#2 | 5.8%(+37.1)#74 |
| 3. | Florence | 40.0% | 6.5%(+33.5)#3 | 5.8%(+34.2)#91 |
| 4. | Junction | 37.5% | 6.5%(+31.0)#4 | 5.8%(+31.7)#100 |
| 5. | Carman | 32.4% | 6.5%(+25.9)#5 | 5.8%(+26.7)#145 |
| 6. | Mill Creek | 28.6% | 6.5%(+22.0)#6 | 5.8%(+22.8)#193 |
| 7. | Kenilworth | 23.0% | 6.5%(+16.5)#7 | 5.8%(+17.2)#294 |
| 8. | Winnetka | 19.9% | 6.5%(+13.4)#8 | 5.8%(+14.1)#401 |
| 9. | Lake Petersburg | 18.2% | 6.5%(+11.7)#9 | 5.8%(+12.4)#486 |
| 10. | Chestnut | 17.5% | 6.5%(+11.0)#10 | 5.8%(+11.7)#525 |
| 11. | Prairietown | 17.4% | 6.5%(+10.9)#11 | 5.8%(+11.6)#531 |
| 12. | Downs | 16.8% | 6.5%(+10.3)#12 | 5.8%(+11.1)#575 |
| 13. | Wenonah | 16.7% | 6.5%(+10.1)#13 | 5.8%(+10.9)#596 |
| 14. | Galt | 16.4% | 6.5%(+9.84)#14 | 5.8%(+10.6)#622 |
| 15. | Western Springs | 16.0% | 6.5%(+9.45)#15 | 5.8%(+10.2)#666 |
| 16. | Lawrence | 15.8% | 6.5%(+9.31)#16 | 5.8%(+10.1)#679 |
| 17. | Trout Valley | 15.7% | 6.5%(+9.15)#17 | 5.8%(+9.91)#697 |
| 18. | Arbury Hills | 15.5% | 6.5%(+8.98)#18 | 5.8%(+9.74)#724 |
| 19. | Lockport Heights | 15.4% | 6.5%(+8.89)#19 | 5.8%(+9.65)#740 |
| 20. | Irwin | 15.4% | 6.5%(+8.86)#20 | 5.8%(+9.62)#755 |
| 21. | Le Roy | 15.1% | 6.5%(+8.54)#21 | 5.8%(+9.30)#790 |
| 22. | Glencoe | 15.1% | 6.5%(+8.54)#22 | 5.8%(+9.30)#791 |
| 23. | Creal Springs | 14.9% | 6.5%(+8.41)#23 | 5.8%(+9.17)#811 |
| 24. | Deer Park | 14.4% | 6.5%(+7.88)#24 | 5.8%(+8.64)#885 |
| 25. | Northfield | 14.4% | 6.5%(+7.84)#25 | 5.8%(+8.60)#891 |
| 26. | Riverwoods | 14.1% | 6.5%(+7.58)#26 | 5.8%(+8.34)#943 |
| 27. | Deerfield | 13.5% | 6.5%(+6.94)#27 | 5.8%(+7.70)#1,070 |
| 28. | Flossmoor | 13.5% | 6.5%(+6.93)#28 | 5.8%(+7.69)#1,079 |
| 29. | Danvers | 13.4% | 6.5%(+6.92)#29 | 5.8%(+7.68)#1,082 |
| 30. | Kildeer | 13.4% | 6.5%(+6.90)#30 | 5.8%(+7.66)#1,086 |
| 31. | Hawthorn Woods | 13.4% | 6.5%(+6.87)#31 | 5.8%(+7.63)#1,093 |
| 32. | Solon Mills | 13.3% | 6.5%(+6.74)#32 | 5.8%(+7.50)#1,122 |
| 33. | Barrington | 13.1% | 6.5%(+6.62)#33 | 5.8%(+7.38)#1,158 |
| 34. | La Grange | 13.0% | 6.5%(+6.51)#34 | 5.8%(+7.27)#1,192 |
| 35. | Hinsdale | 13.0% | 6.5%(+6.44)#35 | 5.8%(+7.20)#1,207 |
| 36. | Kappa | 12.9% | 6.5%(+6.41)#36 | 5.8%(+7.17)#1,221 |
| 37. | Golden | 12.9% | 6.5%(+6.39)#37 | 5.8%(+7.15)#1,223 |
| 38. | Northbrook | 12.9% | 6.5%(+6.33)#38 | 5.8%(+7.09)#1,236 |
| 39. | Lexington | 12.8% | 6.5%(+6.25)#39 | 5.8%(+7.01)#1,261 |
| 40. | Aviston | 12.7% | 6.5%(+6.21)#40 | 5.8%(+6.97)#1,276 |
| 41. | Hopkins Park | 12.6% | 6.5%(+6.11)#41 | 5.8%(+6.87)#1,293 |
| 42. | North Barrington | 12.6% | 6.5%(+6.07)#42 | 5.8%(+6.82)#1,304 |
| 43. | Cable | 12.5% | 6.5%(+5.98)#43 | 5.8%(+6.74)#1,329 |
| 44. | Bentley | 12.5% | 6.5%(+5.98)#44 | 5.8%(+6.74)#1,340 |
| 45. | Rapids City | 12.2% | 6.5%(+5.72)#45 | 5.8%(+6.48)#1,401 |
| 46. | The Galena Territory | 12.2% | 6.5%(+5.65)#46 | 5.8%(+6.41)#1,425 |
| 47. | Olivet | 12.2% | 6.5%(+5.64)#47 | 5.8%(+6.40)#1,431 |
| 48. | Campton Hills | 12.1% | 6.5%(+5.57)#48 | 5.8%(+6.33)#1,457 |
| 49. | Hampton | 12.1% | 6.5%(+5.56)#49 | 5.8%(+6.32)#1,466 |
| 50. | Grafton | 12.1% | 6.5%(+5.55)#50 | 5.8%(+6.31)#1,469 |
| 51. | East Brooklyn | 12.0% | 6.5%(+5.48)#51 | 5.8%(+6.24)#1,496 |
| 52. | Glen Ellyn | 12.0% | 6.5%(+5.45)#52 | 5.8%(+6.21)#1,500 |
| 53. | Standard City | 11.9% | 6.5%(+5.42)#53 | 5.8%(+6.18)#1,508 |
| 54. | Lisle | 11.9% | 6.5%(+5.33)#54 | 5.8%(+6.09)#1,540 |
| 55. | Glenview | 11.8% | 6.5%(+5.32)#55 | 5.8%(+6.08)#1,544 |
| 56. | Arlington Heights | 11.8% | 6.5%(+5.26)#56 | 5.8%(+6.02)#1,564 |
| 57. | Campus | 11.8% | 6.5%(+5.24)#57 | 5.8%(+6.00)#1,573 |
| 58. | Wilmette | 11.7% | 6.5%(+5.18)#58 | 5.8%(+5.94)#1,596 |
| 59. | Vernon Hills | 11.7% | 6.5%(+5.13)#59 | 5.8%(+5.89)#1,629 |
| 60. | Volo | 11.6% | 6.5%(+5.13)#60 | 5.8%(+5.89)#1,631 |
| 61. | Park Ridge | 11.6% | 6.5%(+5.07)#61 | 5.8%(+5.83)#1,646 |
| 62. | Twin Grove | 11.5% | 6.5%(+4.95)#62 | 5.8%(+5.71)#1,692 |
| 63. | Inverness | 11.5% | 6.5%(+4.95)#63 | 5.8%(+5.71)#1,695 |
| 64. | Union Hill | 11.4% | 6.5%(+4.91)#64 | 5.8%(+5.67)#1,720 |
| 65. | Tallula | 11.3% | 6.5%(+4.75)#65 | 5.8%(+5.51)#1,780 |
| 66. | Hopewell | 11.2% | 6.5%(+4.68)#66 | 5.8%(+5.44)#1,806 |
| 67. | Saybrook | 11.2% | 6.5%(+4.63)#67 | 5.8%(+5.39)#1,827 |
| 68. | Rochester | 11.1% | 6.5%(+4.55)#68 | 5.8%(+5.31)#1,872 |
| 69. | Sugar Grove | 11.0% | 6.5%(+4.48)#69 | 5.8%(+5.24)#1,904 |
| 70. | Downers Grove | 11.0% | 6.5%(+4.47)#70 | 5.8%(+5.23)#1,908 |
| 71. | Oakwood Hills | 10.9% | 6.5%(+4.39)#71 | 5.8%(+5.15)#1,944 |
| 72. | Ewing | 10.9% | 6.5%(+4.36)#72 | 5.8%(+5.12)#1,960 |
| 73. | Germantown | 10.9% | 6.5%(+4.33)#73 | 5.8%(+5.09)#1,972 |
| 74. | Sawyerville | 10.8% | 6.5%(+4.32)#74 | 5.8%(+5.08)#1,975 |
| 75. | Mound Station | 10.8% | 6.5%(+4.29)#75 | 5.8%(+5.05)#1,990 |
| 76. | Hampshire | 10.7% | 6.5%(+4.14)#76 | 5.8%(+4.90)#2,066 |
| 77. | Naperville | 10.6% | 6.5%(+4.09)#77 | 5.8%(+4.85)#2,091 |
| 78. | Burr Ridge | 10.6% | 6.5%(+4.08)#78 | 5.8%(+4.84)#2,100 |
| 79. | Buffalo Grove | 10.6% | 6.5%(+4.05)#79 | 5.8%(+4.81)#2,119 |
| 80. | Bulpitt | 10.6% | 6.5%(+4.05)#80 | 5.8%(+4.81)#2,127 |
| 81. | Wayne | 10.5% | 6.5%(+3.93)#81 | 5.8%(+4.69)#2,180 |
| 82. | Emden | 10.4% | 6.5%(+3.88)#82 | 5.8%(+4.64)#2,205 |
| 83. | Oak Park | 10.3% | 6.5%(+3.83)#83 | 5.8%(+4.59)#2,227 |
| 84. | Albers | 10.3% | 6.5%(+3.81)#84 | 5.8%(+4.57)#2,237 |
| 85. | Sleepy Hollow | 10.3% | 6.5%(+3.81)#85 | 5.8%(+4.57)#2,239 |
| 86. | Plainfield | 10.2% | 6.5%(+3.64)#86 | 5.8%(+4.40)#2,330 |
| 87. | Oakbrook Terrace | 10.1% | 6.5%(+3.63)#87 | 5.8%(+4.39)#2,339 |
| 88. | Millstadt | 10.1% | 6.5%(+3.62)#88 | 5.8%(+4.38)#2,344 |
| 89. | Libertyville | 10.1% | 6.5%(+3.62)#89 | 5.8%(+4.38)#2,350 |
| 90. | Goodfield | 10.1% | 6.5%(+3.60)#90 | 5.8%(+4.36)#2,364 |
| 91. | Highland Park | 10.1% | 6.5%(+3.58)#91 | 5.8%(+4.34)#2,368 |
| 92. | Strasburg | 10.0% | 6.5%(+3.48)#92 | 5.8%(+4.24)#2,430 |
| 93. | Biggsville | 9.9% | 6.5%(+3.42)#93 | 5.8%(+4.18)#2,477 |
| 94. | Chatham | 9.9% | 6.5%(+3.41)#94 | 5.8%(+4.17)#2,484 |
| 95. | Golf | 9.8% | 6.5%(+3.33)#95 | 5.8%(+4.09)#2,539 |
| 96. | Wauconda | 9.8% | 6.5%(+3.27)#96 | 5.8%(+4.03)#2,573 |
| 97. | Ivesdale | 9.7% | 6.5%(+3.21)#97 | 5.8%(+3.97)#2,608 |
| 98. | Silvis | 9.7% | 6.5%(+3.21)#98 | 5.8%(+3.97)#2,609 |
| 99. | Candlewick Lake | 9.7% | 6.5%(+3.21)#99 | 5.8%(+3.97)#2,611 |
| 100. | Deer Creek | 9.7% | 6.5%(+3.20)#100 | 5.8%(+3.96)#2,614 |
Common Questions
What are the Top 10 Cities with the Highest Percentage of Population Employed in Business & Financial in Illinois?
Top 10 Cities with the Highest Percentage of Population Employed in Business & Financial in Illinois are:
#1
55.6%
#2
40.0%
#3
37.5%
#4
28.6%
#5
23.0%
#6
19.9%
#7
18.2%
#8
17.5%
#9
16.8%
#10
16.7%
What city has the Highest Percentage of Population Employed in Business & Financial in Illinois?
Mulkeytown has the Highest Percentage of Population Employed in Business & Financial in Illinois with 55.6%.
What is the Percentage of Population Employed in Business & Financial in the State of Illinois?
Percentage of Population Employed in Business & Financial in Illinois is 6.5%.
What is the Percentage of Population Employed in Business & Financial in the United States?
Percentage of Population Employed in Business & Financial in the United States is 5.8%.