Zip Codes with the Highest Percentage of Population Employed in Education Instruction & Library in Washington
RELATED REPORTS & OPTIONS
Education Instruction & Library
Washington
Compare Zip Codes
Map of Zip Codes with the Highest Percentage of Population Employed in Education Instruction & Library in Washington
0.0%
60.0%
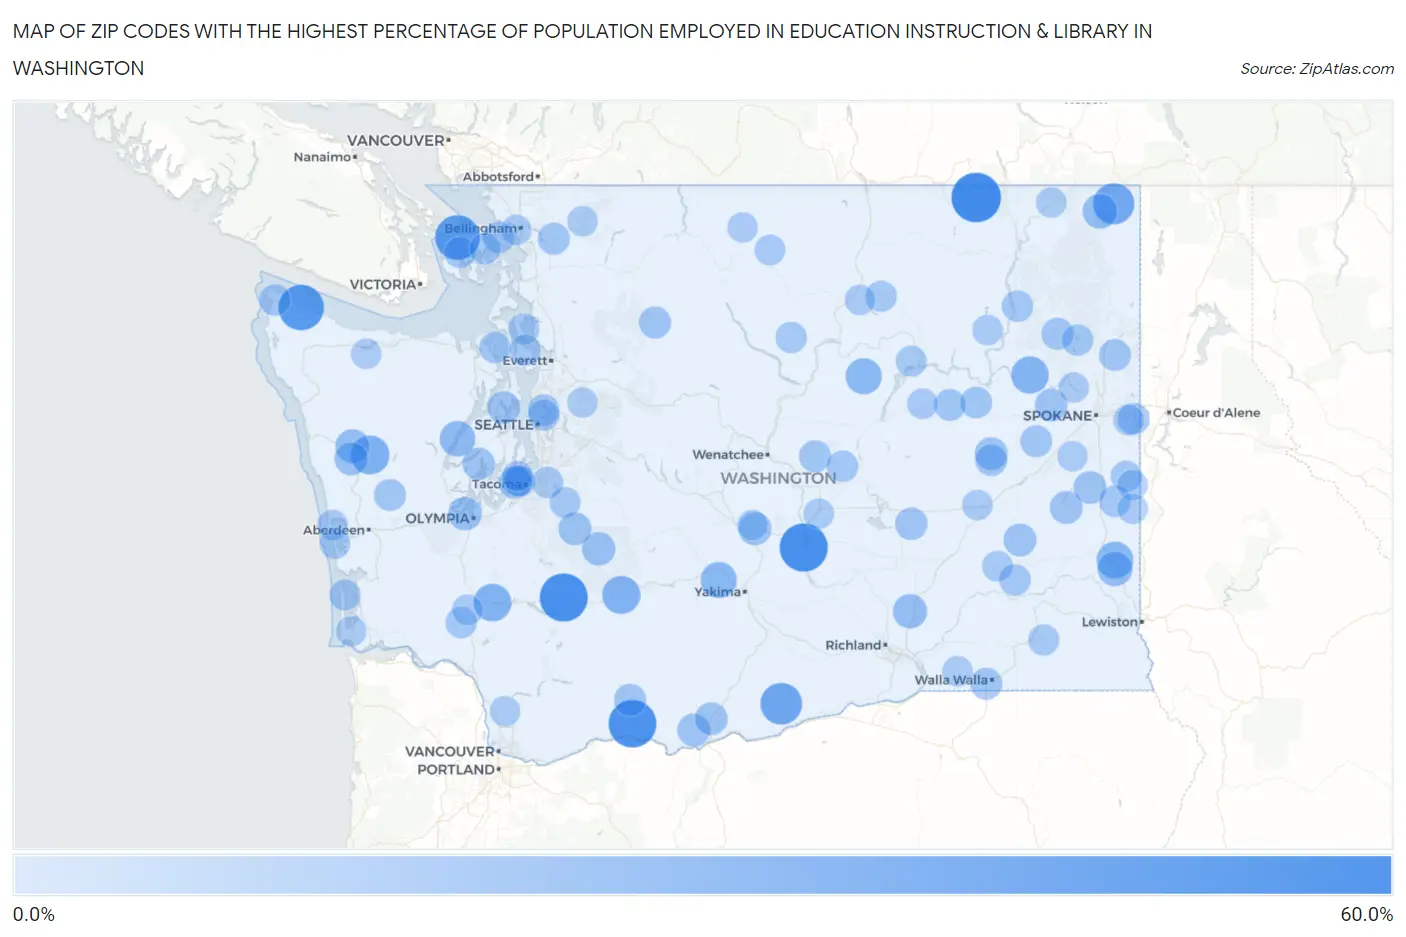
Zip Codes with the Highest Percentage of Population Employed in Education Instruction & Library in Washington
| Zip Code | % Employed | vs State | vs National | |
| 1. | 99121 | 54.5% | 5.7% (+48.8)#1 | 6.2% (+48.4)#49 |
| 2. | 98950 | 51.1% | 5.7% (+45.3)#2 | 6.2% (+44.9)#65 |
| 3. | 98336 | 50.9% | 5.7% (+45.2)#3 | 6.2% (+44.7)#66 |
| 4. | 98623 | 50.0% | 5.7% (+44.3)#4 | 6.2% (+43.8)#77 |
| 5. | 98381 | 44.7% | 5.7% (+38.9)#5 | 6.2% (+38.5)#103 |
| 6. | 98297 | 42.9% | 5.7% (+37.1)#6 | 6.2% (+36.7)#115 |
| 7. | 99322 | 35.5% | 5.7% (+29.7)#7 | 6.2% (+29.3)#172 |
| 8. | 99153 | 34.3% | 5.7% (+28.5)#8 | 6.2% (+28.1)#197 |
| 9. | 98575 | 28.3% | 5.7% (+22.5)#9 | 6.2% (+22.1)#292 |
| 10. | 98361 | 26.4% | 5.7% (+20.7)#10 | 6.2% (+20.3)#328 |
| 11. | 98542 | 25.6% | 5.7% (+19.9)#11 | 6.2% (+19.4)#347 |
| 12. | 99040 | 25.4% | 5.7% (+19.7)#12 | 6.2% (+19.2)#352 |
| 13. | 99102 | 23.7% | 5.7% (+18.0)#13 | 6.2% (+17.5)#422 |
| 14. | 98830 | 22.2% | 5.7% (+16.4)#14 | 6.2% (+16.0)#507 |
| 15. | 98923 | 22.0% | 5.7% (+16.2)#15 | 6.2% (+15.8)#515 |
| 16. | 98555 | 20.9% | 5.7% (+15.2)#16 | 6.2% (+14.7)#571 |
| 17. | 99163 | 18.9% | 5.7% (+13.2)#17 | 6.2% (+12.8)#742 |
| 18. | 99152 | 18.6% | 5.7% (+12.9)#18 | 6.2% (+12.5)#770 |
| 19. | 99330 | 18.0% | 5.7% (+12.2)#19 | 6.2% (+11.8)#842 |
| 20. | 98526 | 17.3% | 5.7% (+11.6)#20 | 6.2% (+11.1)#910 |
| 21. | 98304 | 15.9% | 5.7% (+10.2)#21 | 6.2% (+9.72)#1,109 |
| 22. | 98505 | 15.6% | 5.7% (+9.87)#22 | 6.2% (+9.42)#1,170 |
| 23. | 98566 | 15.5% | 5.7% (+9.80)#23 | 6.2% (+9.35)#1,179 |
| 24. | 98934 | 14.8% | 5.7% (+9.04)#24 | 6.2% (+8.59)#1,328 |
| 25. | 98323 | 14.4% | 5.7% (+8.68)#25 | 6.2% (+8.23)#1,413 |
| 26. | 98613 | 14.3% | 5.7% (+8.61)#26 | 6.2% (+8.16)#1,434 |
| 27. | 99171 | 14.3% | 5.7% (+8.55)#27 | 6.2% (+8.10)#1,446 |
| 28. | 99134 | 14.3% | 5.7% (+8.55)#28 | 6.2% (+8.10)#1,450 |
| 29. | 99149 | 14.3% | 5.7% (+8.55)#29 | 6.2% (+8.10)#1,457 |
| 30. | 99105 | 14.3% | 5.7% (+8.55)#30 | 6.2% (+8.10)#1,466 |
| 31. | 98620 | 14.2% | 5.7% (+8.48)#31 | 6.2% (+8.03)#1,478 |
| 32. | 99029 | 13.9% | 5.7% (+8.18)#32 | 6.2% (+7.73)#1,564 |
| 33. | 98345 | 13.9% | 5.7% (+8.13)#33 | 6.2% (+7.69)#1,581 |
| 34. | 98465 | 13.8% | 5.7% (+8.02)#34 | 6.2% (+7.57)#1,629 |
| 35. | 98857 | 13.5% | 5.7% (+7.77)#35 | 6.2% (+7.32)#1,708 |
| 36. | 98524 | 13.2% | 5.7% (+7.46)#36 | 6.2% (+7.01)#1,827 |
| 37. | 98241 | 13.1% | 5.7% (+7.37)#37 | 6.2% (+6.92)#1,863 |
| 38. | 98650 | 13.0% | 5.7% (+7.26)#38 | 6.2% (+6.81)#1,903 |
| 39. | 99181 | 12.6% | 5.7% (+6.91)#39 | 6.2% (+6.46)#2,052 |
| 40. | 98220 | 12.6% | 5.7% (+6.85)#40 | 6.2% (+6.40)#2,080 |
| 41. | 99008 | 12.5% | 5.7% (+6.76)#41 | 6.2% (+6.32)#2,118 |
| 42. | 99154 | 12.5% | 5.7% (+6.76)#42 | 6.2% (+6.32)#2,133 |
| 43. | 98845 | 12.4% | 5.7% (+6.62)#43 | 6.2% (+6.18)#2,198 |
| 44. | 99009 | 12.3% | 5.7% (+6.54)#44 | 6.2% (+6.09)#2,252 |
| 45. | 99324 | 12.3% | 5.7% (+6.52)#45 | 6.2% (+6.08)#2,259 |
| 46. | 98563 | 12.1% | 5.7% (+6.41)#46 | 6.2% (+5.97)#2,310 |
| 47. | 99117 | 11.9% | 5.7% (+6.18)#47 | 6.2% (+5.73)#2,431 |
| 48. | 99185 | 11.9% | 5.7% (+6.14)#48 | 6.2% (+5.69)#2,463 |
| 49. | 99019 | 11.9% | 5.7% (+6.13)#49 | 6.2% (+5.68)#2,465 |
| 50. | 98823 | 11.6% | 5.7% (+5.86)#50 | 6.2% (+5.41)#2,639 |
| 51. | 98358 | 11.4% | 5.7% (+5.67)#51 | 6.2% (+5.22)#2,776 |
| 52. | 98243 | 11.4% | 5.7% (+5.63)#52 | 6.2% (+5.18)#2,808 |
| 53. | 98357 | 11.4% | 5.7% (+5.61)#53 | 6.2% (+5.17)#2,816 |
| 54. | 99333 | 11.3% | 5.7% (+5.58)#54 | 6.2% (+5.14)#2,832 |
| 55. | 99158 | 11.3% | 5.7% (+5.55)#55 | 6.2% (+5.10)#2,864 |
| 56. | 99131 | 11.1% | 5.7% (+5.38)#56 | 6.2% (+4.93)#2,988 |
| 57. | 98115 | 11.1% | 5.7% (+5.34)#57 | 6.2% (+4.89)#3,008 |
| 58. | 98262 | 11.0% | 5.7% (+5.25)#58 | 6.2% (+4.80)#3,069 |
| 59. | 99148 | 10.9% | 5.7% (+5.20)#59 | 6.2% (+4.75)#3,108 |
| 60. | 98593 | 10.9% | 5.7% (+5.15)#60 | 6.2% (+4.70)#3,143 |
| 61. | 98047 | 10.7% | 5.7% (+4.99)#61 | 6.2% (+4.55)#3,254 |
| 62. | 98834 | 10.7% | 5.7% (+4.93)#62 | 6.2% (+4.48)#3,305 |
| 63. | 98105 | 10.5% | 5.7% (+4.81)#63 | 6.2% (+4.36)#3,420 |
| 64. | 98841 | 10.5% | 5.7% (+4.78)#64 | 6.2% (+4.33)#3,446 |
| 65. | 99328 | 10.5% | 5.7% (+4.77)#65 | 6.2% (+4.32)#3,455 |
| 66. | 98279 | 10.4% | 5.7% (+4.67)#66 | 6.2% (+4.23)#3,546 |
| 67. | 98282 | 10.3% | 5.7% (+4.57)#67 | 6.2% (+4.12)#3,639 |
| 68. | 99018 | 10.3% | 5.7% (+4.54)#68 | 6.2% (+4.10)#3,664 |
| 69. | 98640 | 10.2% | 5.7% (+4.43)#69 | 6.2% (+3.98)#3,766 |
| 70. | 98260 | 10.1% | 5.7% (+4.38)#70 | 6.2% (+3.93)#3,815 |
| 71. | 98385 | 10.1% | 5.7% (+4.37)#71 | 6.2% (+3.92)#3,830 |
| 72. | 99133 | 10.1% | 5.7% (+4.35)#72 | 6.2% (+3.90)#3,840 |
| 73. | 98416 | 9.9% | 5.7% (+4.18)#73 | 6.2% (+3.73)#4,033 |
| 74. | 98596 | 9.7% | 5.7% (+4.00)#74 | 6.2% (+3.56)#4,244 |
| 75. | 98406 | 9.6% | 5.7% (+3.87)#75 | 6.2% (+3.43)#4,387 |
| 76. | 99016 | 9.5% | 5.7% (+3.71)#76 | 6.2% (+3.27)#4,582 |
| 77. | 99371 | 9.4% | 5.7% (+3.64)#77 | 6.2% (+3.19)#4,682 |
| 78. | 98862 | 9.4% | 5.7% (+3.62)#78 | 6.2% (+3.17)#4,710 |
| 79. | 98407 | 9.3% | 5.7% (+3.57)#79 | 6.2% (+3.12)#4,791 |
| 80. | 99103 | 9.2% | 5.7% (+3.50)#80 | 6.2% (+3.05)#4,886 |
| 81. | 98824 | 9.1% | 5.7% (+3.36)#81 | 6.2% (+2.91)#5,089 |
| 82. | 98569 | 9.1% | 5.7% (+3.35)#82 | 6.2% (+2.90)#5,101 |
| 83. | 98244 | 9.0% | 5.7% (+3.30)#83 | 6.2% (+2.85)#5,183 |
| 84. | 99360 | 9.0% | 5.7% (+3.27)#84 | 6.2% (+2.83)#5,219 |
| 85. | 98225 | 9.0% | 5.7% (+3.23)#85 | 6.2% (+2.78)#5,285 |
| 86. | 98595 | 8.9% | 5.7% (+3.15)#86 | 6.2% (+2.70)#5,426 |
| 87. | 99138 | 8.9% | 5.7% (+3.14)#87 | 6.2% (+2.69)#5,431 |
| 88. | 99004 | 8.9% | 5.7% (+3.12)#88 | 6.2% (+2.67)#5,460 |
| 89. | 99169 | 8.8% | 5.7% (+3.08)#89 | 6.2% (+2.64)#5,520 |
| 90. | 99033 | 8.8% | 5.7% (+3.04)#90 | 6.2% (+2.59)#5,586 |
| 91. | 98629 | 8.7% | 5.7% (+3.01)#91 | 6.2% (+2.57)#5,626 |
| 92. | 98840 | 8.7% | 5.7% (+2.99)#92 | 6.2% (+2.54)#5,673 |
| 93. | 99026 | 8.7% | 5.7% (+2.96)#93 | 6.2% (+2.51)#5,743 |
| 94. | 99128 | 8.7% | 5.7% (+2.93)#94 | 6.2% (+2.48)#5,804 |
| 95. | 99157 | 8.6% | 5.7% (+2.90)#95 | 6.2% (+2.45)#5,853 |
| 96. | 98019 | 8.6% | 5.7% (+2.90)#96 | 6.2% (+2.45)#5,858 |
| 97. | 98926 | 8.6% | 5.7% (+2.89)#97 | 6.2% (+2.45)#5,865 |
| 98. | 98833 | 8.6% | 5.7% (+2.88)#98 | 6.2% (+2.44)#5,887 |
| 99. | 98363 | 8.6% | 5.7% (+2.85)#99 | 6.2% (+2.40)#5,952 |
| 100. | 98624 | 8.6% | 5.7% (+2.84)#100 | 6.2% (+2.39)#5,968 |
Common Questions
What are the Top 10 Zip Codes with the Highest Percentage of Population Employed in Education Instruction & Library in Washington?
Top 10 Zip Codes with the Highest Percentage of Population Employed in Education Instruction & Library in Washington are:
What zip code has the Highest Percentage of Population Employed in Education Instruction & Library in Washington?
99121 has the Highest Percentage of Population Employed in Education Instruction & Library in Washington with 54.5%.
What is the Percentage of Population Employed in Education Instruction & Library in the State of Washington?
Percentage of Population Employed in Education Instruction & Library in Washington is 5.7%.
What is the Percentage of Population Employed in Education Instruction & Library in the United States?
Percentage of Population Employed in Education Instruction & Library in the United States is 6.2%.