Zip Codes with the Highest Percentage of Population Employed in Cleaning & Maintenance in Puyallup, WA
RELATED REPORTS & OPTIONS
Cleaning & Maintenance
Puyallup
Compare Zip Codes
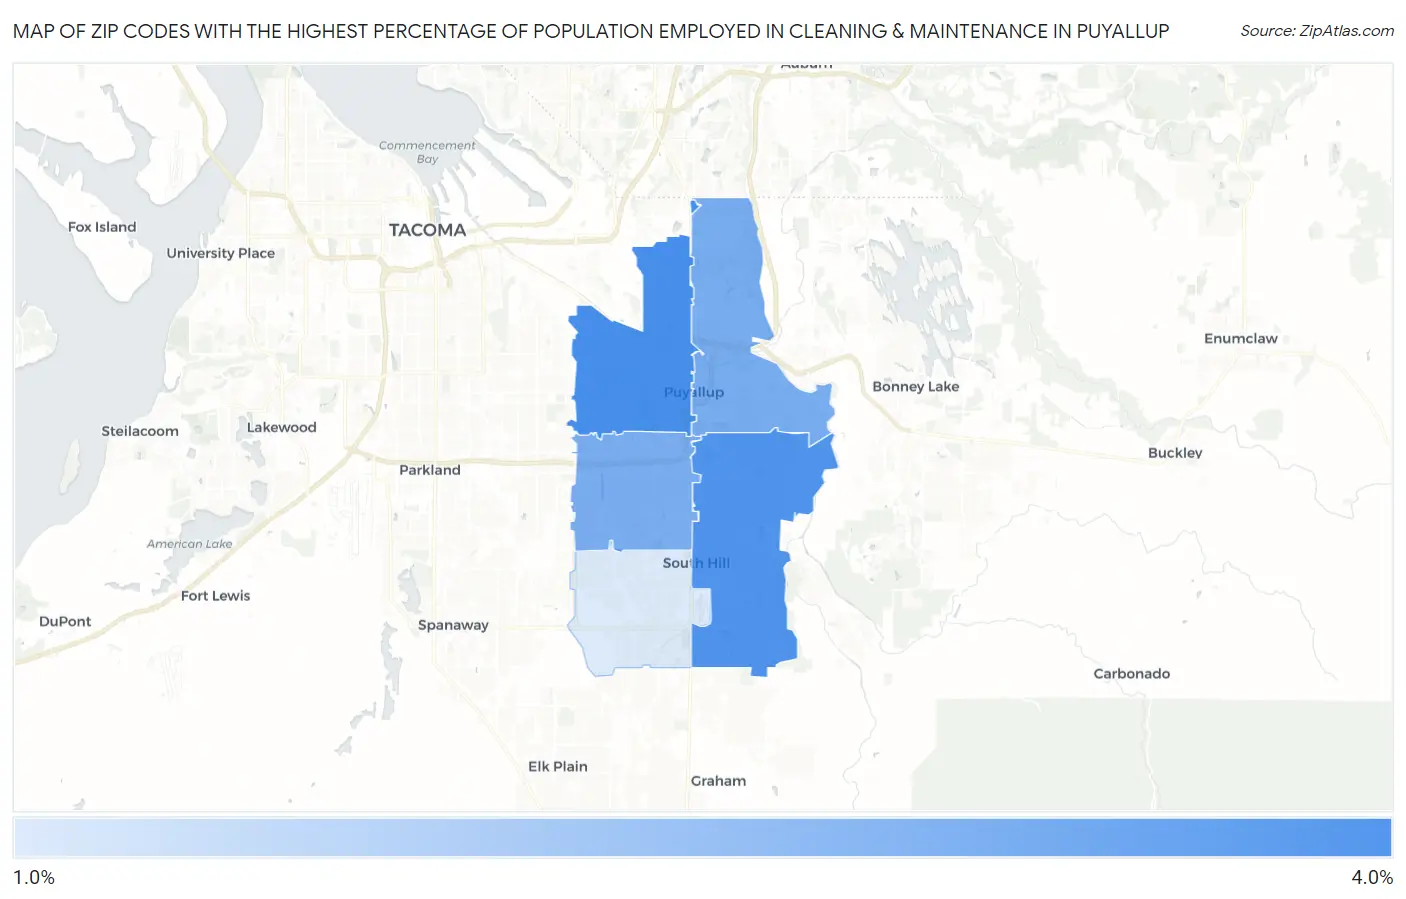
Map of Zip Codes with the Highest Percentage of Population Employed in Cleaning & Maintenance in Puyallup
1.6%
3.2%
Zip Codes with the Highest Percentage of Population Employed in Cleaning & Maintenance in Puyallup, WA
| Zip Code | % Employed | vs State | vs National | |
| 1. | 98371 | 3.2% | 3.0%(+0.209)#259 | 3.5%(-0.291)#14,931 |
| 2. | 98374 | 3.1% | 3.0%(+0.107)#274 | 3.5%(-0.392)#15,418 |
| 3. | 98372 | 2.7% | 3.0%(-0.314)#322 | 3.5%(-0.814)#17,624 |
| 4. | 98373 | 2.6% | 3.0%(-0.351)#323 | 3.5%(-0.851)#17,797 |
| 5. | 98375 | 1.6% | 3.0%(-1.42)#417 | 3.5%(-1.92)#23,194 |
1
Common Questions
What are the Top 3 Zip Codes with the Highest Percentage of Population Employed in Cleaning & Maintenance in Puyallup, WA?
Top 3 Zip Codes with the Highest Percentage of Population Employed in Cleaning & Maintenance in Puyallup, WA are:
What zip code has the Highest Percentage of Population Employed in Cleaning & Maintenance in Puyallup, WA?
98371 has the Highest Percentage of Population Employed in Cleaning & Maintenance in Puyallup, WA with 3.2%.
What is the Percentage of Population Employed in Cleaning & Maintenance in Puyallup, WA?
Percentage of Population Employed in Cleaning & Maintenance in Puyallup is 1.9%.
What is the Percentage of Population Employed in Cleaning & Maintenance in Washington?
Percentage of Population Employed in Cleaning & Maintenance in Washington is 3.0%.
What is the Percentage of Population Employed in Cleaning & Maintenance in the United States?
Percentage of Population Employed in Cleaning & Maintenance in the United States is 3.5%.