Zip Codes with the Highest Percentage of Population Employed in Cleaning & Maintenance in Bellingham, WA
RELATED REPORTS & OPTIONS
Cleaning & Maintenance
Bellingham
Compare Zip Codes
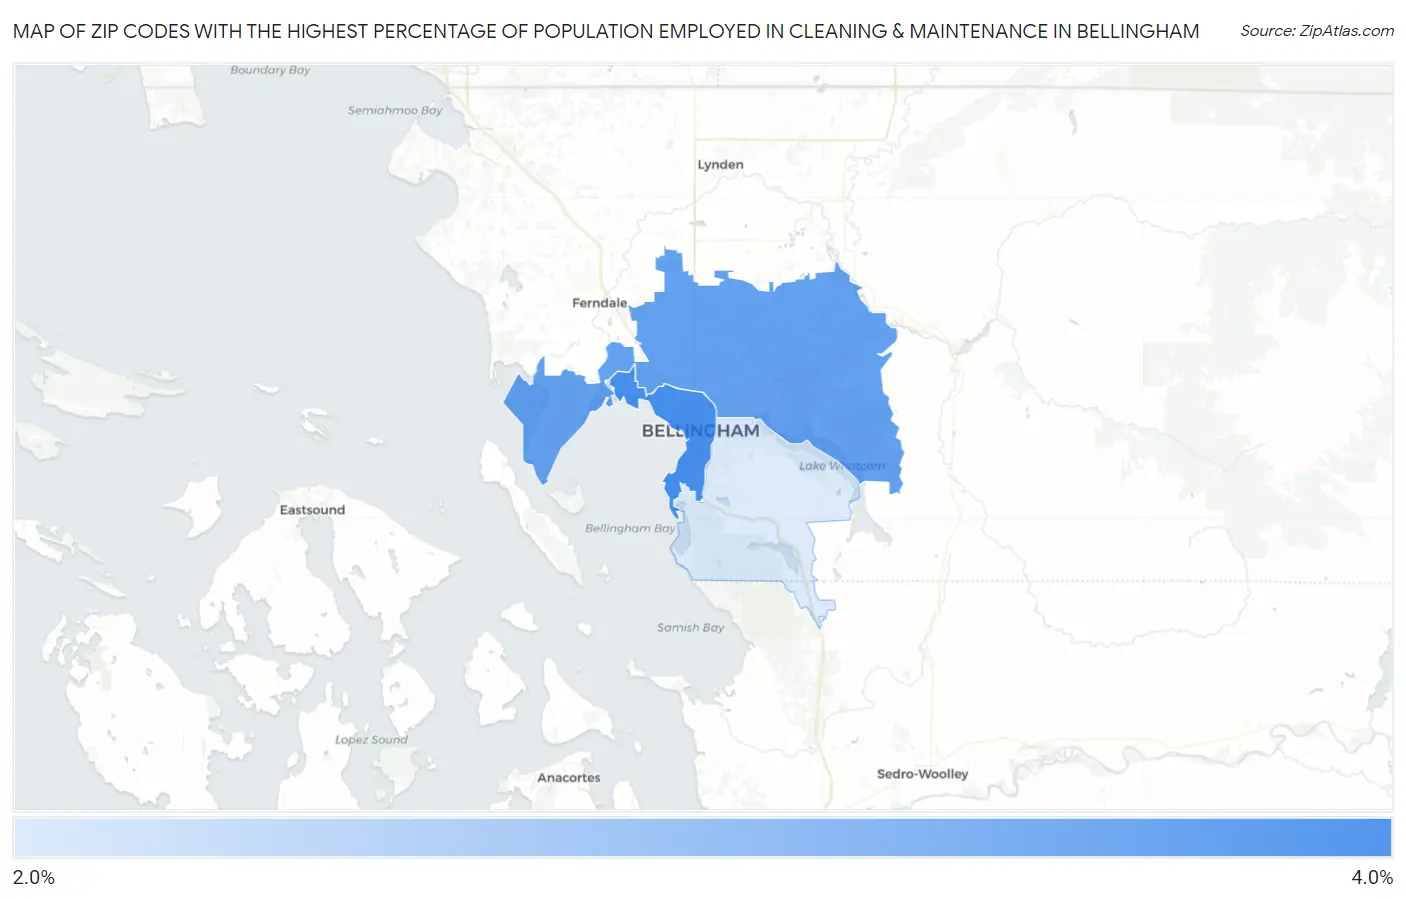
Map of Zip Codes with the Highest Percentage of Population Employed in Cleaning & Maintenance in Bellingham
2.2%
3.8%
Zip Codes with the Highest Percentage of Population Employed in Cleaning & Maintenance in Bellingham, WA
| Zip Code | % Employed | vs State | vs National | |
| 1. | 98225 | 3.8% | 3.0%(+0.845)#203 | 3.5%(+0.345)#12,027 |
| 2. | 98226 | 3.5% | 3.0%(+0.534)#226 | 3.5%(+0.035)#13,358 |
| 3. | 98229 | 2.2% | 3.0%(-0.832)#373 | 3.5%(-1.33)#20,326 |
1
Common Questions
What are the Top Zip Codes with the Highest Percentage of Population Employed in Cleaning & Maintenance in Bellingham, WA?
Top Zip Codes with the Highest Percentage of Population Employed in Cleaning & Maintenance in Bellingham, WA are:
What zip code has the Highest Percentage of Population Employed in Cleaning & Maintenance in Bellingham, WA?
98225 has the Highest Percentage of Population Employed in Cleaning & Maintenance in Bellingham, WA with 3.8%.
What is the Percentage of Population Employed in Cleaning & Maintenance in Bellingham, WA?
Percentage of Population Employed in Cleaning & Maintenance in Bellingham is 3.2%.
What is the Percentage of Population Employed in Cleaning & Maintenance in Washington?
Percentage of Population Employed in Cleaning & Maintenance in Washington is 3.0%.
What is the Percentage of Population Employed in Cleaning & Maintenance in the United States?
Percentage of Population Employed in Cleaning & Maintenance in the United States is 3.5%.