Cities with the Highest Wage/Income Gap (%) in Connecticut
RELATED REPORTS & OPTIONS
Highest Wage/Income Gap (%)
Connecticut
Compare Cities
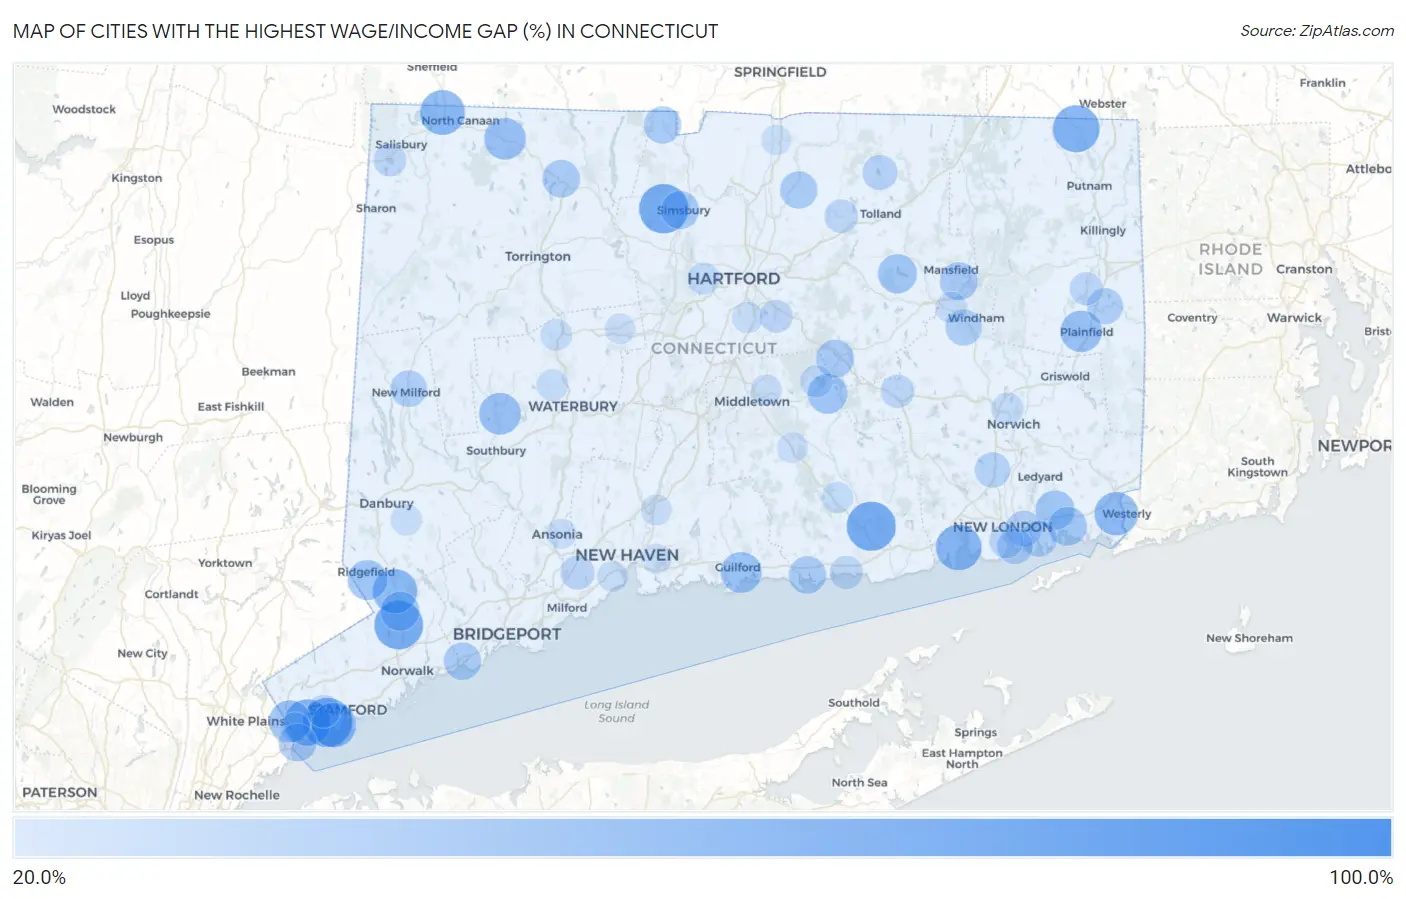
Map of Cities with the Highest Wage/Income Gap (%) in Connecticut
0.0%
100.0%
Cities with the Highest Wage/Income Gap (%) in Connecticut
| City | Wage/Income Gap (%) | vs State | vs National | |
| 1. | Mamanasco Lake | 92.2% | 27.8%(+0.643)#1 | 28.0%(+0.642)#64 |
| 2. | Tokeneke | 84.2% | 27.8%(+0.564)#2 | 28.0%(+0.562)#135 |
| 3. | Cornwall | 77.1% | 27.8%(+0.493)#3 | 28.0%(+0.491)#241 |
| 4. | Noroton | 72.0% | 27.8%(+0.442)#4 | 28.0%(+0.441)#414 |
| 5. | Staples | 72.0% | 27.8%(+0.441)#5 | 28.0%(+0.440)#423 |
| 6. | West Simsbury | 70.4% | 27.8%(+0.425)#6 | 28.0%(+0.424)#490 |
| 7. | Riverside | 70.0% | 27.8%(+0.422)#7 | 28.0%(+0.420)#507 |
| 8. | Plattsville | 69.9% | 27.8%(+0.420)#8 | 28.0%(+0.419)#516 |
| 9. | Essex Village | 69.5% | 27.8%(+0.417)#9 | 28.0%(+0.415)#540 |
| 10. | Wilton Center | 68.6% | 27.8%(+0.408)#10 | 28.0%(+0.406)#604 |
| 11. | West Mountain | 66.6% | 27.8%(+0.388)#11 | 28.0%(+0.387)#751 |
| 12. | Bantam Borough | 66.6% | 27.8%(+0.388)#12 | 28.0%(+0.386)#755 |
| 13. | Quinebaug | 64.1% | 27.8%(+0.363)#13 | 28.0%(+0.361)#964 |
| 14. | Greenwich | 63.1% | 27.8%(+0.353)#14 | 28.0%(+0.352)#1,080 |
| 15. | Mill Plain | 62.3% | 27.8%(+0.345)#15 | 28.0%(+0.343)#1,175 |
| 16. | Niantic | 61.1% | 27.8%(+0.333)#16 | 28.0%(+0.332)#1,306 |
| 17. | Compo | 60.8% | 27.8%(+0.330)#17 | 28.0%(+0.328)#1,336 |
| 18. | Canaan | 59.4% | 27.8%(+0.315)#18 | 28.0%(+0.314)#1,530 |
| 19. | Old Greenwich | 59.0% | 27.8%(+0.312)#19 | 28.0%(+0.311)#1,588 |
| 20. | Georgetown | 58.7% | 27.8%(+0.308)#20 | 28.0%(+0.307)#1,647 |
| 21. | Old Hill | 57.1% | 27.8%(+0.293)#21 | 28.0%(+0.291)#1,884 |
| 22. | Pawcatuck | 56.0% | 27.8%(+0.282)#22 | 28.0%(+0.280)#2,096 |
| 23. | Westport | 56.0% | 27.8%(+0.282)#23 | 28.0%(+0.280)#2,108 |
| 24. | Daniels Farm | 54.5% | 27.8%(+0.267)#24 | 28.0%(+0.265)#2,405 |
| 25. | Glenville | 52.6% | 27.8%(+0.248)#25 | 28.0%(+0.246)#2,828 |
| 26. | Woodbury Center | 52.0% | 27.8%(+0.242)#26 | 28.0%(+0.240)#2,968 |
| 27. | Norfolk | 51.9% | 27.8%(+0.241)#27 | 28.0%(+0.240)#2,987 |
| 28. | Plainfield Village | 51.7% | 27.8%(+0.239)#28 | 28.0%(+0.237)#3,056 |
| 29. | Greens Farms | 50.6% | 27.8%(+0.228)#29 | 28.0%(+0.226)#3,320 |
| 30. | Guilford Center | 50.1% | 27.8%(+0.223)#30 | 28.0%(+0.221)#3,472 |
| 31. | Tashua | 50.0% | 27.8%(+0.222)#31 | 28.0%(+0.221)#3,478 |
| 32. | Route 7 Gateway | 47.9% | 27.8%(+0.201)#32 | 28.0%(+0.199)#4,121 |
| 33. | Poplar Plains | 47.8% | 27.8%(+0.200)#33 | 28.0%(+0.198)#4,148 |
| 34. | East Hampton | 47.8% | 27.8%(+0.200)#34 | 28.0%(+0.198)#4,165 |
| 35. | Ridgefield | 47.3% | 27.8%(+0.195)#35 | 28.0%(+0.193)#4,330 |
| 36. | Old Mystic | 46.2% | 27.8%(+0.184)#36 | 28.0%(+0.183)#4,674 |
| 37. | Coventry Lake | 46.1% | 27.8%(+0.183)#37 | 28.0%(+0.181)#4,709 |
| 38. | Cannondale | 45.9% | 27.8%(+0.181)#38 | 28.0%(+0.179)#4,788 |
| 39. | Mystic | 45.3% | 27.8%(+0.175)#39 | 28.0%(+0.174)#5,001 |
| 40. | Saugatuck | 44.9% | 27.8%(+0.171)#40 | 28.0%(+0.169)#5,177 |
| 41. | Lakes East | 44.4% | 27.8%(+0.166)#41 | 28.0%(+0.164)#5,359 |
| 42. | Simsbury Center | 43.5% | 27.8%(+0.156)#42 | 28.0%(+0.155)#5,752 |
| 43. | Terramuggus | 43.4% | 27.8%(+0.156)#43 | 28.0%(+0.154)#5,764 |
| 44. | Mansfield Center | 43.2% | 27.8%(+0.154)#44 | 28.0%(+0.152)#5,843 |
| 45. | Byram | 43.0% | 27.8%(+0.152)#45 | 28.0%(+0.150)#5,941 |
| 46. | Winsted | 42.6% | 27.8%(+0.148)#46 | 28.0%(+0.146)#6,128 |
| 47. | Southport | 42.1% | 27.8%(+0.143)#47 | 28.0%(+0.142)#6,324 |
| 48. | Clinton | 42.1% | 27.8%(+0.143)#48 | 28.0%(+0.141)#6,341 |
| 49. | North Granby | 41.9% | 27.8%(+0.140)#49 | 28.0%(+0.139)#6,423 |
| 50. | Broad Brook | 41.7% | 27.8%(+0.139)#50 | 28.0%(+0.138)#6,476 |
| 51. | Lakes West | 40.1% | 27.8%(+0.123)#51 | 28.0%(+0.121)#7,188 |
| 52. | New Milford | 40.1% | 27.8%(+0.122)#52 | 28.0%(+0.121)#7,205 |
| 53. | South Windham | 39.4% | 27.8%(+0.116)#53 | 28.0%(+0.114)#7,528 |
| 54. | Moosup | 39.3% | 27.8%(+0.115)#54 | 28.0%(+0.113)#7,556 |
| 55. | Long Hill | 39.0% | 27.8%(+0.112)#55 | 28.0%(+0.110)#7,722 |
| 56. | Poquonock Bridge | 38.8% | 27.8%(+0.110)#56 | 28.0%(+0.108)#7,802 |
| 57. | Groton | 38.2% | 27.8%(+0.104)#57 | 28.0%(+0.102)#8,057 |
| 58. | Oxoboxo River | 37.2% | 27.8%(+0.094)#58 | 28.0%(+0.093)#8,549 |
| 59. | Riverton | 37.0% | 27.8%(+0.091)#59 | 28.0%(+0.090)#8,685 |
| 60. | Fairfield University | 36.7% | 27.8%(+0.089)#60 | 28.0%(+0.087)#8,827 |
| 61. | Crystal Lake | 36.1% | 27.8%(+0.083)#61 | 28.0%(+0.082)#9,104 |
| 62. | Gaylordsville | 34.5% | 27.8%(+0.067)#62 | 28.0%(+0.065)#9,992 |
| 63. | Orange | 34.4% | 27.8%(+0.066)#63 | 28.0%(+0.065)#10,021 |
| 64. | New London | 34.4% | 27.8%(+0.065)#64 | 28.0%(+0.064)#10,051 |
| 65. | Taylor Corners | 34.0% | 27.8%(+0.061)#65 | 28.0%(+0.060)#10,266 |
| 66. | Rockville | 33.3% | 27.8%(+0.055)#66 | 28.0%(+0.053)#10,651 |
| 67. | Colchester | 32.9% | 27.8%(+0.051)#67 | 28.0%(+0.049)#10,867 |
| 68. | Westbrook Center | 32.6% | 27.8%(+0.047)#68 | 28.0%(+0.046)#11,025 |
| 69. | Wauregan | 31.9% | 27.8%(+0.041)#69 | 28.0%(+0.039)#11,388 |
| 70. | Cos Cob | 31.8% | 27.8%(+0.040)#70 | 28.0%(+0.039)#11,412 |
| 71. | Glastonbury Center | 31.8% | 27.8%(+0.040)#71 | 28.0%(+0.039)#11,414 |
| 72. | Lakeville | 31.8% | 27.8%(+0.040)#72 | 28.0%(+0.038)#11,446 |
| 73. | East | 31.6% | 27.8%(+0.038)#73 | 28.0%(+0.036)#11,569 |
| 74. | Northford | 30.8% | 27.8%(+0.030)#74 | 28.0%(+0.029)#11,944 |
| 75. | Lake Pocotopaug | 30.5% | 27.8%(+0.027)#75 | 28.0%(+0.026)#12,086 |
| 76. | Norwich | 30.1% | 27.8%(+0.023)#76 | 28.0%(+0.021)#12,347 |
| 77. | Sandy Hook | 30.0% | 27.8%(+0.022)#77 | 28.0%(+0.021)#12,380 |
| 78. | West Hartford | 29.6% | 27.8%(+0.018)#78 | 28.0%(+0.016)#12,646 |
| 79. | Thomaston | 28.9% | 27.8%(+0.011)#79 | 28.0%(+0.009)#13,045 |
| 80. | Oakville | 28.8% | 27.8%(+0.010)#80 | 28.0%(+0.009)#13,069 |
| 81. | Bridgewater | 28.7% | 27.8%(+0.009)#81 | 28.0%(+0.007)#13,159 |
| 82. | Willimantic | 28.7% | 27.8%(+0.008)#82 | 28.0%(+0.007)#13,197 |
| 83. | Woodmont Borough | 28.6% | 27.8%(+0.008)#83 | 28.0%(+0.007)#13,201 |
| 84. | Chester Center | 28.5% | 27.8%(+0.007)#84 | 28.0%(+0.005)#13,283 |
| 85. | Trumbull Center | 28.2% | 27.8%(+0.003)#85 | 28.0%(+0.002)#13,447 |
| 86. | Bethel | 28.0% | 27.8%(+0.002)#86 | 28.0%(+0.000)#13,533 |
| 87. | Wethersfield | 27.6% | 27.8%(-0.002)#87 | 28.0%(-0.004)#13,755 |
| 88. | Naugatuck Borough | 27.5% | 27.8%(-0.004)#88 | 28.0%(-0.005)#13,842 |
| 89. | Portland | 27.3% | 27.8%(-0.005)#89 | 28.0%(-0.007)#13,939 |
| 90. | North Haven | 27.2% | 27.8%(-0.006)#90 | 28.0%(-0.008)#13,982 |
| 91. | West Haven | 27.2% | 27.8%(-0.006)#91 | 28.0%(-0.008)#13,990 |
| 92. | Noroton Heights | 26.9% | 27.8%(-0.009)#92 | 28.0%(-0.011)#14,144 |
| 93. | Higganum | 26.7% | 27.8%(-0.011)#93 | 28.0%(-0.013)#14,233 |
| 94. | Danielson Borough | 26.2% | 27.8%(-0.017)#94 | 28.0%(-0.018)#14,550 |
| 95. | Bristol | 26.1% | 27.8%(-0.017)#95 | 28.0%(-0.019)#14,586 |
| 96. | Ansonia | 26.1% | 27.8%(-0.018)#96 | 28.0%(-0.019)#14,595 |
| 97. | Thompsonville | 25.9% | 27.8%(-0.020)#97 | 28.0%(-0.021)#14,701 |
| 98. | Sacred Heart University | 25.7% | 27.8%(-0.021)#98 | 28.0%(-0.023)#14,804 |
| 99. | Pemberwick | 25.6% | 27.8%(-0.022)#99 | 28.0%(-0.024)#14,887 |
| 100. | East Haven | 25.4% | 27.8%(-0.024)#100 | 28.0%(-0.026)#14,974 |
1
2Common Questions
What are the Top 10 Cities with the Highest Wage/Income Gap (%) in Connecticut?
Top 10 Cities with the Highest Wage/Income Gap (%) in Connecticut are:
#1
70.4%
#2
70.0%
#3
69.5%
#4
68.6%
#5
64.1%
#6
63.1%
#7
61.1%
#8
59.4%
#9
59.0%
#10
58.7%
What city has the Highest Wage/Income Gap (%) in Connecticut?
West Simsbury has the Highest Wage/Income Gap (%) in Connecticut with 70.4%.
What is the Wage / Income Gap in Percentage Terms in the State of Connecticut?
Wage / Income Gap in Percentage Terms in Connecticut is 27.8%.
What is the Wage / Income Gap in Percentage Terms in the United States?
Wage / Income Gap in Percentage Terms in the United States is 28.0%.