Cities with the Highest Wage/Income Gap (%) in Michigan
RELATED REPORTS & OPTIONS
Highest Wage/Income Gap (%)
Michigan
Compare Cities
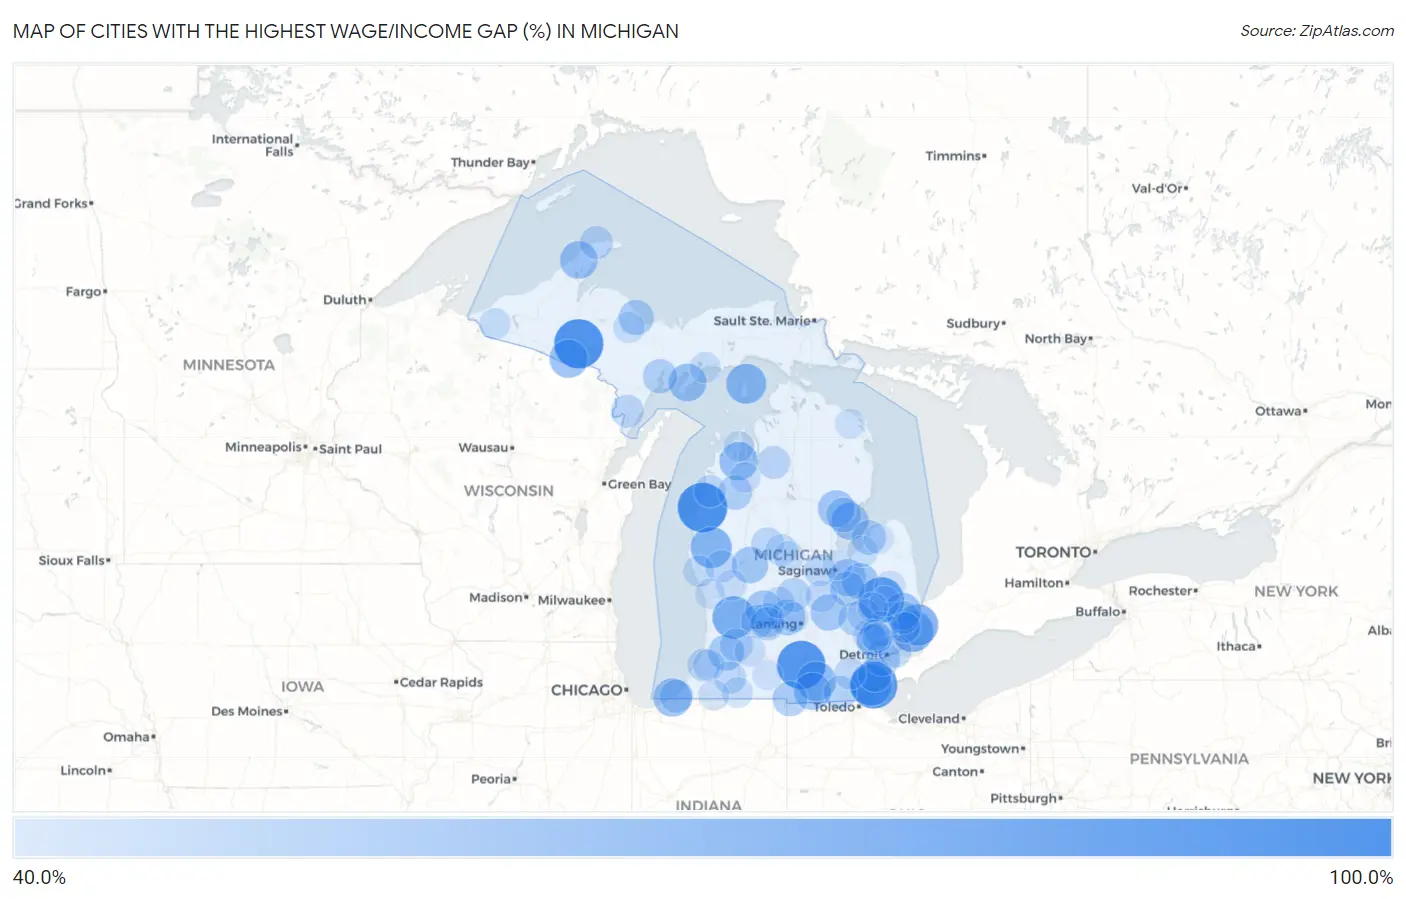
Map of Cities with the Highest Wage/Income Gap (%) in Michigan
0.0%
100.0%
Cities with the Highest Wage/Income Gap (%) in Michigan
| City | Wage/Income Gap (%) | vs State | vs National | |
| 1. | Filer City | 83.3% | 31.6%(+0.517)#1 | 28.0%(+0.553)#141 |
| 2. | Amasa | 82.6% | 31.6%(+0.510)#2 | 28.0%(+0.546)#153 |
| 3. | Spring Arbor | 81.2% | 31.6%(+0.496)#3 | 28.0%(+0.532)#171 |
| 4. | Cambria | 78.9% | 31.6%(+0.473)#4 | 28.0%(+0.510)#204 |
| 5. | Stony Point | 78.9% | 31.6%(+0.473)#5 | 28.0%(+0.509)#205 |
| 6. | Lake Gogebic | 77.7% | 31.6%(+0.461)#6 | 28.0%(+0.498)#226 |
| 7. | Attica | 76.0% | 31.6%(+0.444)#7 | 28.0%(+0.480)#264 |
| 8. | Falmouth | 75.9% | 31.6%(+0.442)#8 | 28.0%(+0.479)#267 |
| 9. | Bruce Crossing | 74.4% | 31.6%(+0.428)#9 | 28.0%(+0.464)#304 |
| 10. | Byron Center | 70.6% | 31.6%(+0.390)#10 | 28.0%(+0.426)#472 |
| 11. | Detroit Beach | 69.5% | 31.6%(+0.378)#11 | 28.0%(+0.415)#544 |
| 12. | Pearl Beach | 69.2% | 31.6%(+0.376)#12 | 28.0%(+0.412)#567 |
| 13. | Marine City | 68.9% | 31.6%(+0.373)#13 | 28.0%(+0.409)#584 |
| 14. | Walkerville | 68.2% | 31.6%(+0.366)#14 | 28.0%(+0.402)#630 |
| 15. | St James | 66.3% | 31.6%(+0.347)#15 | 28.0%(+0.383)#783 |
| 16. | Crystal | 66.2% | 31.6%(+0.346)#16 | 28.0%(+0.383)#790 |
| 17. | Scotts | 65.4% | 31.6%(+0.338)#17 | 28.0%(+0.375)#844 |
| 18. | Manitou Beach Devils Lake | 65.3% | 31.6%(+0.337)#18 | 28.0%(+0.373)#858 |
| 19. | Lakeport | 64.2% | 31.6%(+0.326)#19 | 28.0%(+0.362)#948 |
| 20. | Greilickville | 63.7% | 31.6%(+0.321)#20 | 28.0%(+0.358)#1,003 |
| 21. | Michiana | 63.6% | 31.6%(+0.319)#21 | 28.0%(+0.356)#1,026 |
| 22. | Caspian | 63.4% | 31.6%(+0.318)#22 | 28.0%(+0.354)#1,041 |
| 23. | Garden | 62.4% | 31.6%(+0.308)#23 | 28.0%(+0.344)#1,161 |
| 24. | Calumet | 62.2% | 31.6%(+0.306)#24 | 28.0%(+0.342)#1,185 |
| 25. | Hudson | 61.6% | 31.6%(+0.299)#25 | 28.0%(+0.336)#1,262 |
| 26. | Au Gres | 61.5% | 31.6%(+0.299)#26 | 28.0%(+0.335)#1,277 |
| 27. | Memphis | 61.0% | 31.6%(+0.293)#27 | 28.0%(+0.330)#1,321 |
| 28. | Prescott | 60.9% | 31.6%(+0.292)#28 | 28.0%(+0.329)#1,328 |
| 29. | Frankenmuth | 60.7% | 31.6%(+0.291)#29 | 28.0%(+0.327)#1,347 |
| 30. | Saranac | 60.2% | 31.6%(+0.286)#30 | 28.0%(+0.322)#1,405 |
| 31. | Morley | 60.1% | 31.6%(+0.285)#31 | 28.0%(+0.321)#1,415 |
| 32. | Millington | 60.1% | 31.6%(+0.285)#32 | 28.0%(+0.321)#1,416 |
| 33. | Bancroft | 59.7% | 31.6%(+0.281)#33 | 28.0%(+0.317)#1,468 |
| 34. | Dorr | 59.1% | 31.6%(+0.275)#34 | 28.0%(+0.312)#1,565 |
| 35. | Gobles | 59.1% | 31.6%(+0.274)#35 | 28.0%(+0.311)#1,583 |
| 36. | Eagle | 58.9% | 31.6%(+0.273)#36 | 28.0%(+0.309)#1,609 |
| 37. | Trowbridge Park | 57.7% | 31.6%(+0.261)#37 | 28.0%(+0.298)#1,781 |
| 38. | Camden | 57.7% | 31.6%(+0.260)#38 | 28.0%(+0.297)#1,794 |
| 39. | Twining | 57.5% | 31.6%(+0.259)#39 | 28.0%(+0.295)#1,824 |
| 40. | River Rouge | 57.4% | 31.6%(+0.257)#40 | 28.0%(+0.294)#1,844 |
| 41. | Bingham Farms | 57.0% | 31.6%(+0.254)#41 | 28.0%(+0.290)#1,903 |
| 42. | Clio | 57.0% | 31.6%(+0.253)#42 | 28.0%(+0.290)#1,913 |
| 43. | Rochester Hills | 56.9% | 31.6%(+0.253)#43 | 28.0%(+0.290)#1,920 |
| 44. | Mesick | 56.9% | 31.6%(+0.252)#44 | 28.0%(+0.289)#1,929 |
| 45. | Bay Port | 56.8% | 31.6%(+0.251)#45 | 28.0%(+0.288)#1,949 |
| 46. | Gladstone | 56.5% | 31.6%(+0.248)#46 | 28.0%(+0.285)#2,009 |
| 47. | Holly | 55.8% | 31.6%(+0.242)#47 | 28.0%(+0.278)#2,136 |
| 48. | Lake Odessa | 55.8% | 31.6%(+0.242)#48 | 28.0%(+0.278)#2,143 |
| 49. | Maple Rapids | 55.8% | 31.6%(+0.242)#49 | 28.0%(+0.278)#2,144 |
| 50. | South Rockwood | 55.7% | 31.6%(+0.241)#50 | 28.0%(+0.277)#2,159 |
| 51. | Freeport | 55.0% | 31.6%(+0.234)#51 | 28.0%(+0.271)#2,291 |
| 52. | Woodland | 55.0% | 31.6%(+0.234)#52 | 28.0%(+0.271)#2,292 |
| 53. | Blissfield | 54.7% | 31.6%(+0.231)#53 | 28.0%(+0.267)#2,350 |
| 54. | New Buffalo | 54.6% | 31.6%(+0.230)#54 | 28.0%(+0.267)#2,366 |
| 55. | Eagle Harbor | 54.3% | 31.6%(+0.227)#55 | 28.0%(+0.263)#2,453 |
| 56. | Rock | 54.3% | 31.6%(+0.227)#56 | 28.0%(+0.263)#2,455 |
| 57. | Otsego | 54.2% | 31.6%(+0.226)#57 | 28.0%(+0.262)#2,484 |
| 58. | Manistee Lake | 54.1% | 31.6%(+0.225)#58 | 28.0%(+0.261)#2,501 |
| 59. | Ortonville | 53.9% | 31.6%(+0.223)#59 | 28.0%(+0.260)#2,533 |
| 60. | Stephenson | 53.9% | 31.6%(+0.222)#60 | 28.0%(+0.259)#2,550 |
| 61. | Grosse Pointe | 53.8% | 31.6%(+0.222)#61 | 28.0%(+0.259)#2,559 |
| 62. | Watervliet | 53.8% | 31.6%(+0.222)#62 | 28.0%(+0.258)#2,566 |
| 63. | Barryton | 53.5% | 31.6%(+0.218)#63 | 28.0%(+0.255)#2,631 |
| 64. | Richmond | 53.5% | 31.6%(+0.218)#64 | 28.0%(+0.255)#2,633 |
| 65. | Fremont | 53.1% | 31.6%(+0.215)#65 | 28.0%(+0.251)#2,707 |
| 66. | Bear Lake | 52.9% | 31.6%(+0.212)#66 | 28.0%(+0.249)#2,760 |
| 67. | Hemlock | 52.8% | 31.6%(+0.212)#67 | 28.0%(+0.248)#2,773 |
| 68. | Marcellus | 52.7% | 31.6%(+0.210)#68 | 28.0%(+0.247)#2,806 |
| 69. | Milan | 52.2% | 31.6%(+0.206)#69 | 28.0%(+0.242)#2,931 |
| 70. | Muir | 52.1% | 31.6%(+0.205)#70 | 28.0%(+0.241)#2,956 |
| 71. | Henderson | 51.9% | 31.6%(+0.203)#71 | 28.0%(+0.240)#2,984 |
| 72. | Orchard Lake Village | 51.9% | 31.6%(+0.203)#72 | 28.0%(+0.239)#3,005 |
| 73. | Beal City | 51.8% | 31.6%(+0.201)#73 | 28.0%(+0.238)#3,037 |
| 74. | Greenland | 51.7% | 31.6%(+0.201)#74 | 28.0%(+0.237)#3,050 |
| 75. | Montague | 51.6% | 31.6%(+0.200)#75 | 28.0%(+0.237)#3,067 |
| 76. | Hartford | 51.6% | 31.6%(+0.199)#76 | 28.0%(+0.236)#3,085 |
| 77. | Franklin | 51.3% | 31.6%(+0.197)#77 | 28.0%(+0.233)#3,147 |
| 78. | Wakefield | 51.2% | 31.6%(+0.196)#78 | 28.0%(+0.232)#3,164 |
| 79. | Palmer | 51.1% | 31.6%(+0.195)#79 | 28.0%(+0.231)#3,196 |
| 80. | Unionville | 51.0% | 31.6%(+0.194)#80 | 28.0%(+0.231)#3,219 |
| 81. | Manistique | 50.8% | 31.6%(+0.192)#81 | 28.0%(+0.228)#3,265 |
| 82. | Constantine | 50.8% | 31.6%(+0.192)#82 | 28.0%(+0.228)#3,277 |
| 83. | Casnovia | 50.6% | 31.6%(+0.190)#83 | 28.0%(+0.227)#3,310 |
| 84. | Richland | 50.6% | 31.6%(+0.189)#84 | 28.0%(+0.226)#3,328 |
| 85. | New Baltimore | 50.5% | 31.6%(+0.189)#85 | 28.0%(+0.226)#3,332 |
| 86. | Edwardsburg | 50.4% | 31.6%(+0.188)#86 | 28.0%(+0.225)#3,369 |
| 87. | Kingsley | 50.3% | 31.6%(+0.187)#87 | 28.0%(+0.223)#3,414 |
| 88. | Mount Pleasant | 50.2% | 31.6%(+0.186)#88 | 28.0%(+0.223)#3,427 |
| 89. | Suttons Bay | 50.2% | 31.6%(+0.186)#89 | 28.0%(+0.222)#3,429 |
| 90. | Brown City | 50.2% | 31.6%(+0.186)#90 | 28.0%(+0.222)#3,439 |
| 91. | Bloomfield Hills | 50.2% | 31.6%(+0.185)#91 | 28.0%(+0.222)#3,451 |
| 92. | Birmingham | 50.0% | 31.6%(+0.183)#92 | 28.0%(+0.220)#3,510 |
| 93. | Imlay City | 49.9% | 31.6%(+0.183)#93 | 28.0%(+0.219)#3,522 |
| 94. | Fruitport | 49.7% | 31.6%(+0.181)#94 | 28.0%(+0.217)#3,564 |
| 95. | Metamora | 49.6% | 31.6%(+0.180)#95 | 28.0%(+0.216)#3,591 |
| 96. | Zilwaukee | 49.6% | 31.6%(+0.179)#96 | 28.0%(+0.216)#3,603 |
| 97. | Posen | 49.5% | 31.6%(+0.178)#97 | 28.0%(+0.215)#3,631 |
| 98. | Elkton | 49.4% | 31.6%(+0.177)#98 | 28.0%(+0.214)#3,665 |
| 99. | Wacousta | 49.3% | 31.6%(+0.177)#99 | 28.0%(+0.214)#3,672 |
| 100. | Union City | 49.3% | 31.6%(+0.177)#100 | 28.0%(+0.213)#3,674 |
Common Questions
What are the Top 10 Cities with the Highest Wage/Income Gap (%) in Michigan?
Top 10 Cities with the Highest Wage/Income Gap (%) in Michigan are:
#1
83.3%
#2
82.6%
#3
81.2%
#4
78.9%
#5
76.0%
#6
70.6%
#7
69.5%
#8
69.2%
#9
68.9%
#10
68.2%
What city has the Highest Wage/Income Gap (%) in Michigan?
Filer City has the Highest Wage/Income Gap (%) in Michigan with 83.3%.
What is the Wage / Income Gap in Percentage Terms in the State of Michigan?
Wage / Income Gap in Percentage Terms in Michigan is 31.6%.
What is the Wage / Income Gap in Percentage Terms in the United States?
Wage / Income Gap in Percentage Terms in the United States is 28.0%.