Cities with the Highest Wage/Income Gap (%) in Utah
RELATED REPORTS & OPTIONS
Highest Wage/Income Gap (%)
Utah
Compare Cities
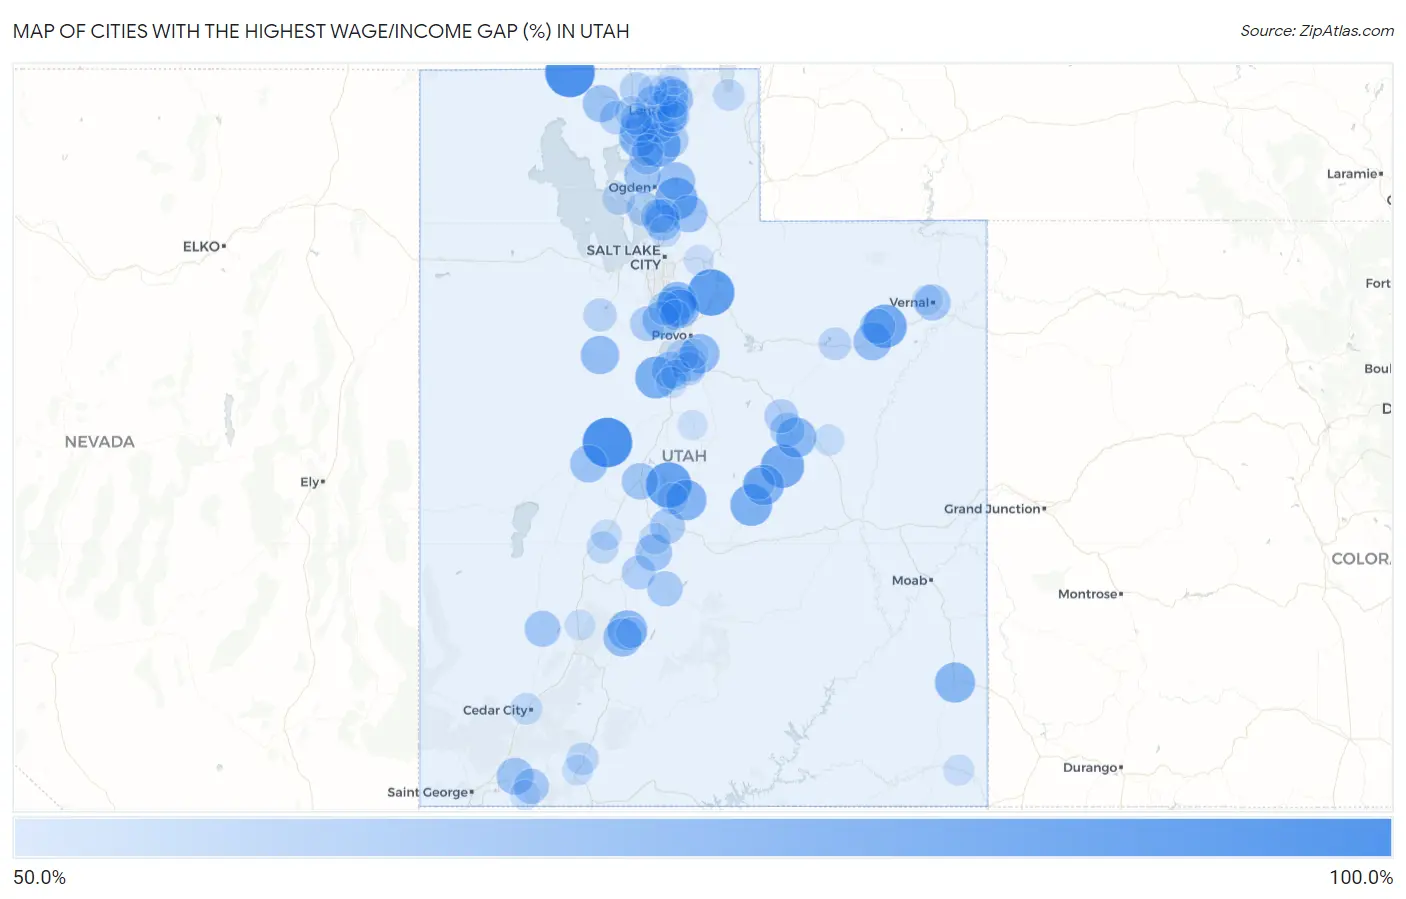
Map of Cities with the Highest Wage/Income Gap (%) in Utah
0.0%
100.0%
Cities with the Highest Wage/Income Gap (%) in Utah
| City | Wage/Income Gap (%) | vs State | vs National | |
| 1. | Snowville | 95.1% | 42.4%(+0.527)#1 | 28.0%(+0.671)#24 |
| 2. | Lynndyl | 94.9% | 42.4%(+0.525)#2 | 28.0%(+0.669)#29 |
| 3. | Midway | 88.2% | 42.4%(+0.459)#3 | 28.0%(+0.602)#93 |
| 4. | Fayette | 86.0% | 42.4%(+0.437)#4 | 28.0%(+0.581)#115 |
| 5. | Mantua | 81.7% | 42.4%(+0.393)#5 | 28.0%(+0.537)#163 |
| 6. | Ballard | 81.5% | 42.4%(+0.392)#6 | 28.0%(+0.535)#166 |
| 7. | Cleveland | 81.2% | 42.4%(+0.388)#7 | 28.0%(+0.532)#173 |
| 8. | Mountain Green | 78.6% | 42.4%(+0.363)#8 | 28.0%(+0.506)#210 |
| 9. | Elberta | 78.5% | 42.4%(+0.361)#9 | 28.0%(+0.505)#211 |
| 10. | Ferron | 77.7% | 42.4%(+0.353)#10 | 28.0%(+0.497)#228 |
| 11. | Mayfield | 74.9% | 42.4%(+0.326)#11 | 28.0%(+0.469)#291 |
| 12. | Castle Dale | 74.9% | 42.4%(+0.325)#12 | 28.0%(+0.469)#293 |
| 13. | Monticello | 74.2% | 42.4%(+0.319)#13 | 28.0%(+0.462)#310 |
| 14. | Wellington | 73.6% | 42.4%(+0.313)#14 | 28.0%(+0.457)#336 |
| 15. | Highland | 72.9% | 42.4%(+0.305)#15 | 28.0%(+0.449)#371 |
| 16. | Junction | 72.6% | 42.4%(+0.303)#16 | 28.0%(+0.446)#388 |
| 17. | Corinne | 72.3% | 42.4%(+0.300)#17 | 28.0%(+0.444)#402 |
| 18. | Mapleton | 71.9% | 42.4%(+0.295)#18 | 28.0%(+0.439)#426 |
| 19. | Alpine | 70.8% | 42.4%(+0.284)#19 | 28.0%(+0.428)#460 |
| 20. | Cedar Hills | 70.6% | 42.4%(+0.283)#20 | 28.0%(+0.427)#465 |
| 21. | Vernon | 70.5% | 42.4%(+0.281)#21 | 28.0%(+0.425)#486 |
| 22. | Hyde Park | 70.4% | 42.4%(+0.280)#22 | 28.0%(+0.424)#489 |
| 23. | Circleville | 69.9% | 42.4%(+0.276)#23 | 28.0%(+0.419)#511 |
| 24. | Myton | 69.6% | 42.4%(+0.272)#24 | 28.0%(+0.416)#535 |
| 25. | Huntsville | 68.9% | 42.4%(+0.265)#25 | 28.0%(+0.409)#585 |
| 26. | Delta | 68.1% | 42.4%(+0.258)#26 | 28.0%(+0.402)#634 |
| 27. | Morgan | 68.0% | 42.4%(+0.256)#27 | 28.0%(+0.400)#649 |
| 28. | Saratoga Springs | 67.9% | 42.4%(+0.255)#28 | 28.0%(+0.399)#654 |
| 29. | Howell | 67.3% | 42.4%(+0.249)#29 | 28.0%(+0.393)#701 |
| 30. | Genola | 66.8% | 42.4%(+0.244)#30 | 28.0%(+0.388)#737 |
| 31. | Virgin | 66.8% | 42.4%(+0.244)#31 | 28.0%(+0.388)#741 |
| 32. | Glenwood | 66.7% | 42.4%(+0.243)#32 | 28.0%(+0.387)#750 |
| 33. | Plain City | 66.5% | 42.4%(+0.242)#33 | 28.0%(+0.385)#760 |
| 34. | Scipio | 66.1% | 42.4%(+0.237)#34 | 28.0%(+0.381)#798 |
| 35. | Vernal | 65.3% | 42.4%(+0.230)#35 | 28.0%(+0.373)#859 |
| 36. | Farmington | 65.1% | 42.4%(+0.227)#36 | 28.0%(+0.371)#878 |
| 37. | Peter | 65.0% | 42.4%(+0.227)#37 | 28.0%(+0.370)#881 |
| 38. | Minersville | 64.9% | 42.4%(+0.226)#38 | 28.0%(+0.370)#896 |
| 39. | Salem | 64.0% | 42.4%(+0.217)#39 | 28.0%(+0.360)#975 |
| 40. | East Basin | 63.8% | 42.4%(+0.215)#40 | 28.0%(+0.358)#993 |
| 41. | Bear River City | 63.6% | 42.4%(+0.213)#41 | 28.0%(+0.357)#1,020 |
| 42. | Rockville | 63.5% | 42.4%(+0.211)#42 | 28.0%(+0.355)#1,038 |
| 43. | Koosharem | 63.4% | 42.4%(+0.210)#43 | 28.0%(+0.354)#1,060 |
| 44. | Salina | 63.2% | 42.4%(+0.209)#44 | 28.0%(+0.353)#1,069 |
| 45. | Smithfield | 62.8% | 42.4%(+0.205)#45 | 28.0%(+0.349)#1,107 |
| 46. | Roosevelt | 62.8% | 42.4%(+0.205)#46 | 28.0%(+0.348)#1,111 |
| 47. | Eagle Mountain | 62.4% | 42.4%(+0.201)#47 | 28.0%(+0.345)#1,159 |
| 48. | Avon | 62.2% | 42.4%(+0.198)#48 | 28.0%(+0.342)#1,186 |
| 49. | Price | 62.0% | 42.4%(+0.196)#49 | 28.0%(+0.340)#1,200 |
| 50. | Fruit Heights | 61.8% | 42.4%(+0.194)#50 | 28.0%(+0.338)#1,224 |
| 51. | Syracuse | 61.6% | 42.4%(+0.192)#51 | 28.0%(+0.336)#1,256 |
| 52. | Providence | 61.2% | 42.4%(+0.188)#52 | 28.0%(+0.332)#1,302 |
| 53. | Willard | 60.8% | 42.4%(+0.184)#53 | 28.0%(+0.328)#1,342 |
| 54. | Monroe | 60.7% | 42.4%(+0.183)#54 | 28.0%(+0.327)#1,350 |
| 55. | Helper | 60.6% | 42.4%(+0.182)#55 | 28.0%(+0.326)#1,366 |
| 56. | Kaysville | 60.6% | 42.4%(+0.182)#56 | 28.0%(+0.326)#1,367 |
| 57. | Lehi | 60.1% | 42.4%(+0.177)#57 | 28.0%(+0.321)#1,420 |
| 58. | Thatcher | 60.0% | 42.4%(+0.176)#58 | 28.0%(+0.320)#1,430 |
| 59. | Wellsville | 59.5% | 42.4%(+0.172)#59 | 28.0%(+0.316)#1,496 |
| 60. | Mendon | 59.5% | 42.4%(+0.171)#60 | 28.0%(+0.315)#1,502 |
| 61. | Elk Ridge | 59.4% | 42.4%(+0.170)#61 | 28.0%(+0.314)#1,528 |
| 62. | Nibley | 59.1% | 42.4%(+0.167)#62 | 28.0%(+0.311)#1,575 |
| 63. | Plymouth | 59.1% | 42.4%(+0.167)#63 | 28.0%(+0.311)#1,580 |
| 64. | Rush Valley | 59.0% | 42.4%(+0.166)#64 | 28.0%(+0.310)#1,592 |
| 65. | Benjamin | 58.9% | 42.4%(+0.165)#65 | 28.0%(+0.309)#1,610 |
| 66. | Honeyville | 58.9% | 42.4%(+0.165)#66 | 28.0%(+0.309)#1,611 |
| 67. | Duchesne | 58.0% | 42.4%(+0.157)#67 | 28.0%(+0.300)#1,733 |
| 68. | Hooper | 57.7% | 42.4%(+0.154)#68 | 28.0%(+0.297)#1,785 |
| 69. | Tremonton | 57.7% | 42.4%(+0.153)#69 | 28.0%(+0.297)#1,796 |
| 70. | Glendale | 57.2% | 42.4%(+0.149)#70 | 28.0%(+0.292)#1,874 |
| 71. | Orangeville | 56.5% | 42.4%(+0.141)#71 | 28.0%(+0.285)#1,996 |
| 72. | Perry | 56.5% | 42.4%(+0.141)#72 | 28.0%(+0.285)#2,002 |
| 73. | Kanosh | 56.4% | 42.4%(+0.140)#73 | 28.0%(+0.284)#2,023 |
| 74. | Elwood | 56.3% | 42.4%(+0.140)#74 | 28.0%(+0.283)#2,034 |
| 75. | Centerville | 56.0% | 42.4%(+0.137)#75 | 28.0%(+0.280)#2,091 |
| 76. | Laketown | 55.7% | 42.4%(+0.133)#76 | 28.0%(+0.277)#2,163 |
| 77. | Cedar City | 55.7% | 42.4%(+0.133)#77 | 28.0%(+0.277)#2,165 |
| 78. | Sigurd | 55.6% | 42.4%(+0.133)#78 | 28.0%(+0.276)#2,182 |
| 79. | Benson | 55.4% | 42.4%(+0.131)#79 | 28.0%(+0.274)#2,218 |
| 80. | Centerfield | 55.2% | 42.4%(+0.129)#80 | 28.0%(+0.273)#2,256 |
| 81. | River Heights | 55.1% | 42.4%(+0.127)#81 | 28.0%(+0.271)#2,282 |
| 82. | Millville | 54.8% | 42.4%(+0.125)#82 | 28.0%(+0.269)#2,320 |
| 83. | Rocky Ridge | 54.4% | 42.4%(+0.120)#83 | 28.0%(+0.264)#2,431 |
| 84. | East Carbon | 54.4% | 42.4%(+0.120)#84 | 28.0%(+0.264)#2,435 |
| 85. | Meadow | 54.3% | 42.4%(+0.119)#85 | 28.0%(+0.263)#2,452 |
| 86. | Orderville | 54.2% | 42.4%(+0.119)#86 | 28.0%(+0.263)#2,466 |
| 87. | Santaquin | 54.1% | 42.4%(+0.117)#87 | 28.0%(+0.261)#2,505 |
| 88. | Montezuma Creek | 54.1% | 42.4%(+0.117)#88 | 28.0%(+0.261)#2,514 |
| 89. | Maeser | 53.9% | 42.4%(+0.116)#89 | 28.0%(+0.260)#2,535 |
| 90. | Kingston | 53.9% | 42.4%(+0.115)#90 | 28.0%(+0.259)#2,553 |
| 91. | Beaver | 53.6% | 42.4%(+0.113)#91 | 28.0%(+0.256)#2,602 |
| 92. | Apple Valley | 53.4% | 42.4%(+0.111)#92 | 28.0%(+0.254)#2,639 |
| 93. | Amalga | 53.1% | 42.4%(+0.108)#93 | 28.0%(+0.252)#2,691 |
| 94. | Summit Park | 53.0% | 42.4%(+0.107)#94 | 28.0%(+0.251)#2,722 |
| 95. | North Logan | 52.9% | 42.4%(+0.105)#95 | 28.0%(+0.249)#2,752 |
| 96. | American Fork | 52.8% | 42.4%(+0.104)#96 | 28.0%(+0.248)#2,783 |
| 97. | Richmond | 52.6% | 42.4%(+0.102)#97 | 28.0%(+0.246)#2,832 |
| 98. | Fountain Green | 52.4% | 42.4%(+0.101)#98 | 28.0%(+0.244)#2,857 |
| 99. | Newton | 52.4% | 42.4%(+0.101)#99 | 28.0%(+0.244)#2,858 |
| 100. | Spanish Fork | 52.4% | 42.4%(+0.100)#100 | 28.0%(+0.244)#2,872 |
Common Questions
What are the Top 10 Cities with the Highest Wage/Income Gap (%) in Utah?
Top 10 Cities with the Highest Wage/Income Gap (%) in Utah are:
What city has the Highest Wage/Income Gap (%) in Utah?
Snowville has the Highest Wage/Income Gap (%) in Utah with 95.1%.
What is the Wage / Income Gap in Percentage Terms in the State of Utah?
Wage / Income Gap in Percentage Terms in Utah is 42.4%.
What is the Wage / Income Gap in Percentage Terms in the United States?
Wage / Income Gap in Percentage Terms in the United States is 28.0%.