Cities with the Highest Wage/Income Gap (%) in Ohio
RELATED REPORTS & OPTIONS
Highest Wage/Income Gap (%)
Ohio
Compare Cities
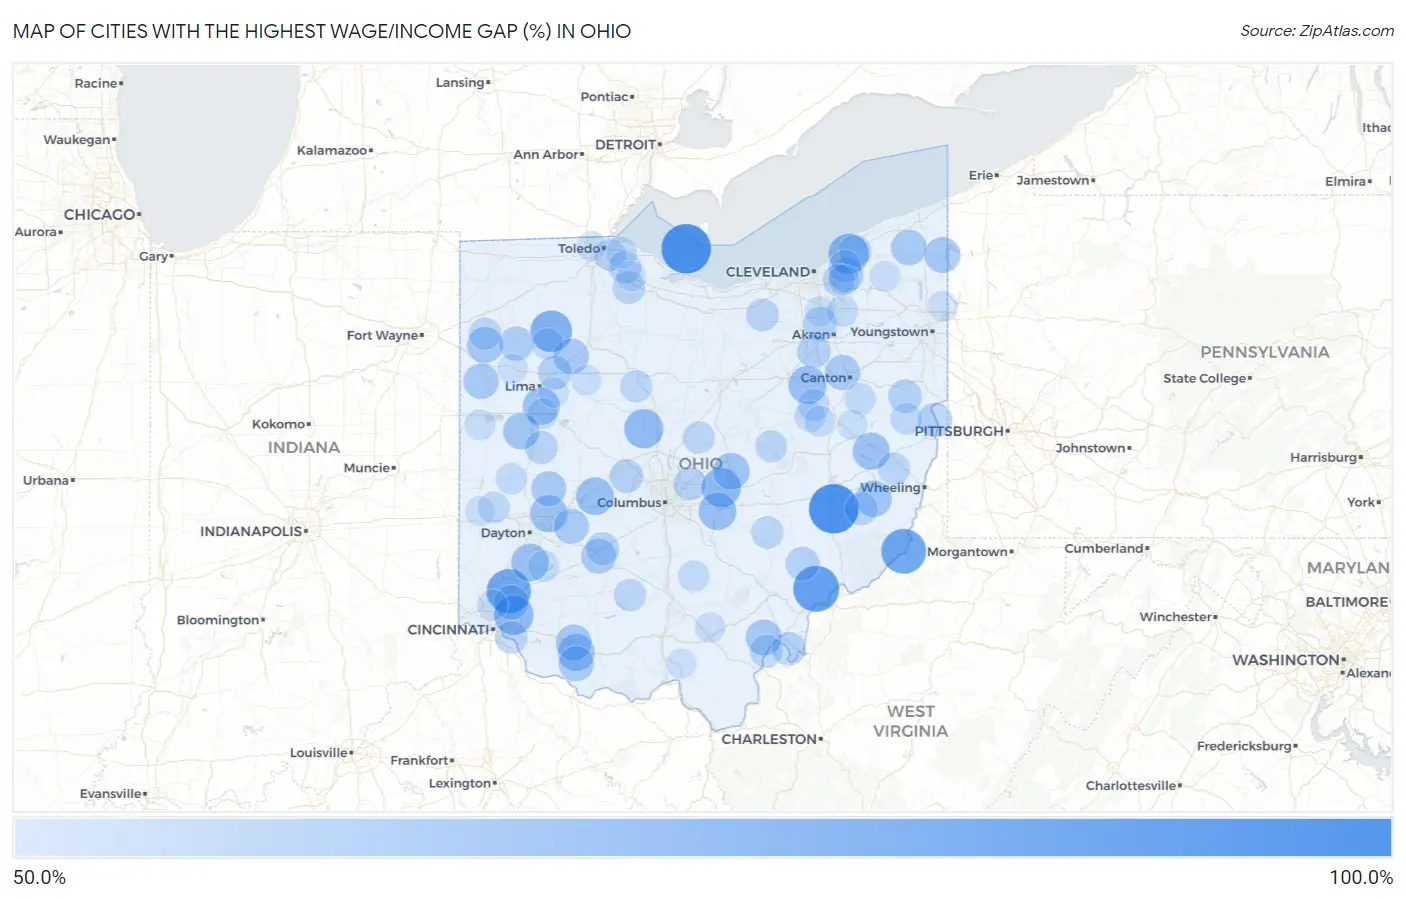
Map of Cities with the Highest Wage/Income Gap (%) in Ohio
0.0%
100.0%
Cities with the Highest Wage/Income Gap (%) in Ohio
| City | Wage/Income Gap (%) | vs State | vs National | |
| 1. | Buffalo | 94.9% | 29.0%(+0.660)#1 | 28.0%(+0.669)#27 |
| 2. | Put In Bay | 94.9% | 29.0%(+0.660)#2 | 28.0%(+0.669)#28 |
| 3. | Brunersburg | 89.8% | 29.0%(+0.608)#3 | 28.0%(+0.618)#84 |
| 4. | Vincent | 87.1% | 29.0%(+0.581)#4 | 28.0%(+0.591)#103 |
| 5. | Sardis | 84.4% | 29.0%(+0.555)#5 | 28.0%(+0.564)#131 |
| 6. | Wetherington | 83.3% | 29.0%(+0.544)#6 | 28.0%(+0.553)#140 |
| 7. | Ai | 82.9% | 29.0%(+0.539)#7 | 28.0%(+0.549)#150 |
| 8. | West Leipsic | 77.6% | 29.0%(+0.487)#8 | 28.0%(+0.497)#229 |
| 9. | Waite Hill | 74.6% | 29.0%(+0.457)#9 | 28.0%(+0.466)#298 |
| 10. | The Village Of Indian Hill | 73.0% | 29.0%(+0.441)#10 | 28.0%(+0.451)#361 |
| 11. | Granville | 72.6% | 29.0%(+0.436)#11 | 28.0%(+0.446)#391 |
| 12. | Prospect | 72.4% | 29.0%(+0.434)#12 | 28.0%(+0.444)#398 |
| 13. | Kidron | 69.9% | 29.0%(+0.409)#13 | 28.0%(+0.419)#514 |
| 14. | Five Points | 69.1% | 29.0%(+0.402)#14 | 28.0%(+0.412)#570 |
| 15. | Catawba | 69.0% | 29.0%(+0.401)#15 | 28.0%(+0.411)#577 |
| 16. | Millersport | 69.0% | 29.0%(+0.401)#16 | 28.0%(+0.410)#578 |
| 17. | Lloydsville | 68.6% | 29.0%(+0.397)#17 | 28.0%(+0.407)#602 |
| 18. | Deersville | 68.1% | 29.0%(+0.391)#18 | 28.0%(+0.401)#639 |
| 19. | Crystal Lakes | 68.0% | 29.0%(+0.390)#19 | 28.0%(+0.400)#651 |
| 20. | Uniopolis | 68.0% | 29.0%(+0.390)#20 | 28.0%(+0.400)#652 |
| 21. | Lake Waynoka | 67.8% | 29.0%(+0.388)#21 | 28.0%(+0.398)#666 |
| 22. | St Louisville | 67.0% | 29.0%(+0.380)#22 | 28.0%(+0.390)#723 |
| 23. | Kettlersville | 66.4% | 29.0%(+0.374)#23 | 28.0%(+0.384)#773 |
| 24. | Barnesville | 66.3% | 29.0%(+0.373)#24 | 28.0%(+0.383)#784 |
| 25. | Haviland | 65.7% | 29.0%(+0.367)#25 | 28.0%(+0.377)#823 |
| 26. | Sardinia | 65.5% | 29.0%(+0.366)#26 | 28.0%(+0.375)#835 |
| 27. | Andover | 65.3% | 29.0%(+0.363)#27 | 28.0%(+0.373)#863 |
| 28. | Rutland | 65.3% | 29.0%(+0.363)#28 | 28.0%(+0.373)#864 |
| 29. | Miller | 64.7% | 29.0%(+0.357)#29 | 28.0%(+0.367)#914 |
| 30. | Rock Creek | 64.6% | 29.0%(+0.357)#30 | 28.0%(+0.366)#921 |
| 31. | Ohio City | 64.3% | 29.0%(+0.353)#31 | 28.0%(+0.363)#943 |
| 32. | Mount Cory | 64.3% | 29.0%(+0.353)#32 | 28.0%(+0.363)#944 |
| 33. | Hills And Dales | 64.0% | 29.0%(+0.351)#33 | 28.0%(+0.360)#973 |
| 34. | Russellville | 63.7% | 29.0%(+0.348)#34 | 28.0%(+0.358)#1,004 |
| 35. | Milledgeville | 63.7% | 29.0%(+0.348)#35 | 28.0%(+0.358)#1,009 |
| 36. | Clifton | 63.7% | 29.0%(+0.348)#36 | 28.0%(+0.357)#1,011 |
| 37. | Christiansburg | 63.5% | 29.0%(+0.345)#37 | 28.0%(+0.355)#1,037 |
| 38. | Brecon | 63.1% | 29.0%(+0.342)#38 | 28.0%(+0.351)#1,082 |
| 39. | New Haven Cdp Huron County | 62.8% | 29.0%(+0.338)#39 | 28.0%(+0.348)#1,118 |
| 40. | Hunting Valley | 62.8% | 29.0%(+0.338)#40 | 28.0%(+0.348)#1,120 |
| 41. | Cloverdale | 62.4% | 29.0%(+0.334)#41 | 28.0%(+0.344)#1,165 |
| 42. | Empire | 62.3% | 29.0%(+0.334)#42 | 28.0%(+0.343)#1,169 |
| 43. | Beaverdam | 61.1% | 29.0%(+0.321)#43 | 28.0%(+0.331)#1,313 |
| 44. | Stockport | 61.0% | 29.0%(+0.321)#44 | 28.0%(+0.330)#1,318 |
| 45. | Summitville | 61.0% | 29.0%(+0.320)#45 | 28.0%(+0.330)#1,319 |
| 46. | Montrose Ghent | 60.8% | 29.0%(+0.318)#46 | 28.0%(+0.328)#1,344 |
| 47. | Racine | 60.6% | 29.0%(+0.316)#47 | 28.0%(+0.326)#1,361 |
| 48. | Unionville Center | 60.5% | 29.0%(+0.315)#48 | 28.0%(+0.325)#1,375 |
| 49. | Doylestown | 60.4% | 29.0%(+0.314)#49 | 28.0%(+0.324)#1,389 |
| 50. | Pekin | 60.0% | 29.0%(+0.310)#50 | 28.0%(+0.320)#1,431 |
| 51. | Jeffersonville | 59.6% | 29.0%(+0.306)#51 | 28.0%(+0.316)#1,486 |
| 52. | New Albany | 59.4% | 29.0%(+0.305)#52 | 28.0%(+0.314)#1,515 |
| 53. | Port Jefferson | 59.4% | 29.0%(+0.304)#53 | 28.0%(+0.314)#1,529 |
| 54. | Batesville | 59.3% | 29.0%(+0.303)#54 | 28.0%(+0.313)#1,541 |
| 55. | Pheasant Run | 59.0% | 29.0%(+0.300)#55 | 28.0%(+0.310)#1,596 |
| 56. | Cheshire | 59.0% | 29.0%(+0.300)#56 | 28.0%(+0.310)#1,597 |
| 57. | Gibsonburg | 58.8% | 29.0%(+0.298)#57 | 28.0%(+0.308)#1,621 |
| 58. | Genoa | 58.6% | 29.0%(+0.297)#58 | 28.0%(+0.307)#1,648 |
| 59. | New Athens | 58.4% | 29.0%(+0.295)#59 | 28.0%(+0.304)#1,678 |
| 60. | Coldstream | 58.4% | 29.0%(+0.294)#60 | 28.0%(+0.304)#1,679 |
| 61. | Kirtland Hills | 58.4% | 29.0%(+0.294)#61 | 28.0%(+0.304)#1,681 |
| 62. | Latty | 58.2% | 29.0%(+0.292)#62 | 28.0%(+0.302)#1,703 |
| 63. | Gates Mills | 58.1% | 29.0%(+0.291)#63 | 28.0%(+0.301)#1,719 |
| 64. | Woodworth | 58.1% | 29.0%(+0.291)#64 | 28.0%(+0.301)#1,723 |
| 65. | Crooksville | 58.1% | 29.0%(+0.291)#65 | 28.0%(+0.301)#1,726 |
| 66. | Sparta | 58.0% | 29.0%(+0.290)#66 | 28.0%(+0.300)#1,739 |
| 67. | Harpster | 57.9% | 29.0%(+0.289)#67 | 28.0%(+0.299)#1,756 |
| 68. | Northwood | 57.7% | 29.0%(+0.288)#68 | 28.0%(+0.298)#1,780 |
| 69. | South Salem | 57.6% | 29.0%(+0.287)#69 | 28.0%(+0.297)#1,798 |
| 70. | Orange | 57.6% | 29.0%(+0.286)#70 | 28.0%(+0.296)#1,802 |
| 71. | Nellie | 57.3% | 29.0%(+0.283)#71 | 28.0%(+0.293)#1,857 |
| 72. | Winesburg | 57.0% | 29.0%(+0.280)#72 | 28.0%(+0.290)#1,915 |
| 73. | Gordon | 56.7% | 29.0%(+0.277)#73 | 28.0%(+0.287)#1,963 |
| 74. | Bergholz | 56.7% | 29.0%(+0.277)#74 | 28.0%(+0.287)#1,969 |
| 75. | Covington | 56.4% | 29.0%(+0.275)#75 | 28.0%(+0.285)#2,011 |
| 76. | Ottawa | 56.4% | 29.0%(+0.274)#76 | 28.0%(+0.284)#2,022 |
| 77. | Curtice | 56.2% | 29.0%(+0.272)#77 | 28.0%(+0.282)#2,058 |
| 78. | Magnolia | 56.1% | 29.0%(+0.271)#78 | 28.0%(+0.281)#2,075 |
| 79. | Adelphi | 56.1% | 29.0%(+0.271)#79 | 28.0%(+0.281)#2,080 |
| 80. | Walnut Creek | 55.8% | 29.0%(+0.268)#80 | 28.0%(+0.278)#2,148 |
| 81. | Hudson | 55.5% | 29.0%(+0.266)#81 | 28.0%(+0.276)#2,195 |
| 82. | Moreland Hills | 55.5% | 29.0%(+0.266)#82 | 28.0%(+0.275)#2,201 |
| 83. | Corwin | 55.5% | 29.0%(+0.265)#83 | 28.0%(+0.275)#2,205 |
| 84. | Coldwater | 55.1% | 29.0%(+0.261)#84 | 28.0%(+0.271)#2,289 |
| 85. | St Johns | 54.9% | 29.0%(+0.259)#85 | 28.0%(+0.269)#2,308 |
| 86. | Greenhills | 54.8% | 29.0%(+0.258)#86 | 28.0%(+0.268)#2,329 |
| 87. | Sugarcreek | 54.7% | 29.0%(+0.257)#87 | 28.0%(+0.267)#2,363 |
| 88. | Lawrenceville | 54.6% | 29.0%(+0.256)#88 | 28.0%(+0.266)#2,381 |
| 89. | Middlefield | 54.2% | 29.0%(+0.252)#89 | 28.0%(+0.262)#2,475 |
| 90. | Dola | 54.2% | 29.0%(+0.252)#90 | 28.0%(+0.262)#2,482 |
| 91. | Roswell | 54.1% | 29.0%(+0.251)#91 | 28.0%(+0.261)#2,499 |
| 92. | Westminster | 54.0% | 29.0%(+0.251)#92 | 28.0%(+0.261)#2,516 |
| 93. | Coalton | 53.8% | 29.0%(+0.249)#93 | 28.0%(+0.258)#2,560 |
| 94. | Yankee Lake | 53.8% | 29.0%(+0.248)#94 | 28.0%(+0.258)#2,575 |
| 95. | Minford | 53.5% | 29.0%(+0.246)#95 | 28.0%(+0.256)#2,614 |
| 96. | Richfield | 53.5% | 29.0%(+0.246)#96 | 28.0%(+0.256)#2,615 |
| 97. | Elmore | 53.5% | 29.0%(+0.246)#97 | 28.0%(+0.255)#2,619 |
| 98. | West Manchester | 53.5% | 29.0%(+0.245)#98 | 28.0%(+0.255)#2,627 |
| 99. | Ottawa Hills | 53.4% | 29.0%(+0.245)#99 | 28.0%(+0.255)#2,634 |
| 100. | Delphos | 53.3% | 29.0%(+0.244)#100 | 28.0%(+0.254)#2,652 |
Common Questions
What are the Top 10 Cities with the Highest Wage/Income Gap (%) in Ohio?
Top 10 Cities with the Highest Wage/Income Gap (%) in Ohio are:
#1
94.9%
#2
94.9%
#3
87.1%
#4
84.4%
#5
83.3%
#6
77.6%
#7
74.6%
#8
73.0%
#9
72.6%
#10
72.4%
What city has the Highest Wage/Income Gap (%) in Ohio?
Buffalo has the Highest Wage/Income Gap (%) in Ohio with 94.9%.
What is the Wage / Income Gap in Percentage Terms in the State of Ohio?
Wage / Income Gap in Percentage Terms in Ohio is 29.0%.
What is the Wage / Income Gap in Percentage Terms in the United States?
Wage / Income Gap in Percentage Terms in the United States is 28.0%.