Cities with the Highest Wage/Income Gap (%) in Nevada
RELATED REPORTS & OPTIONS
Highest Wage/Income Gap (%)
Nevada
Compare Cities
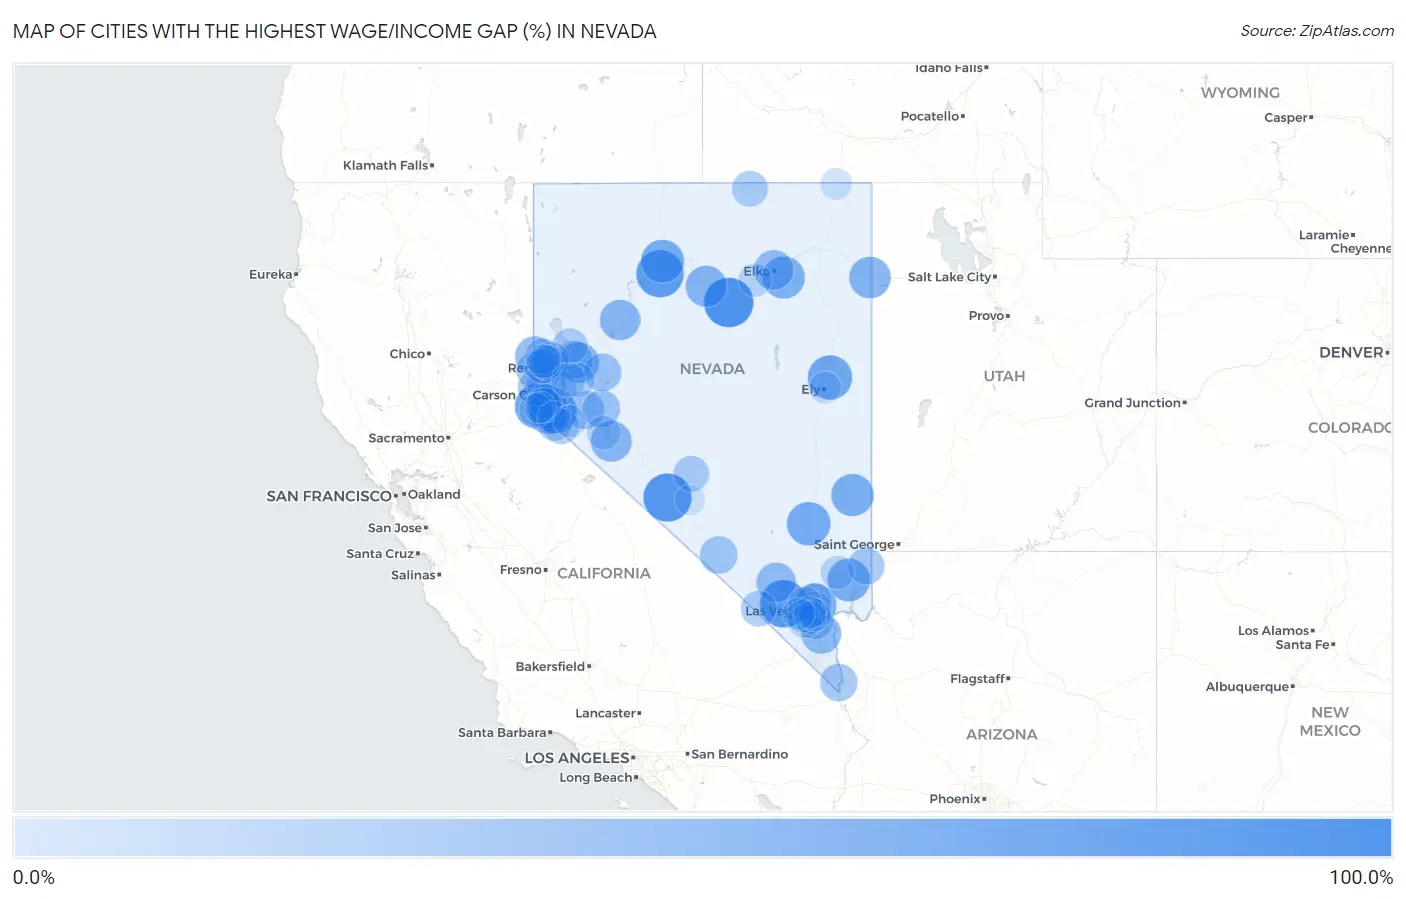
Map of Cities with the Highest Wage/Income Gap (%) in Nevada
0.0%
100.0%
Cities with the Highest Wage/Income Gap (%) in Nevada
| City | Wage/Income Gap (%) | vs State | vs National | |
| 1. | Crescent Valley | 86.9% | 21.4%(+0.655)#1 | 28.0%(+0.589)#107 |
| 2. | Silver Peak | 80.6% | 21.4%(+0.592)#2 | 28.0%(+0.526)#183 |
| 3. | Mount Charleston | 78.1% | 21.4%(+0.567)#3 | 28.0%(+0.501)#215 |
| 4. | Grass Valley | 77.2% | 21.4%(+0.558)#4 | 28.0%(+0.492)#238 |
| 5. | Fish Springs | 70.4% | 21.4%(+0.490)#5 | 28.0%(+0.424)#491 |
| 6. | Zephyr Cove | 67.5% | 21.4%(+0.461)#6 | 28.0%(+0.395)#687 |
| 7. | Mcgill | 64.2% | 21.4%(+0.428)#7 | 28.0%(+0.362)#954 |
| 8. | Alamo | 60.2% | 21.4%(+0.388)#8 | 28.0%(+0.322)#1,409 |
| 9. | Winnemucca | 58.5% | 21.4%(+0.371)#9 | 28.0%(+0.305)#1,669 |
| 10. | Nellis Afb | 56.7% | 21.4%(+0.353)#10 | 28.0%(+0.287)#1,965 |
| 11. | Moapa Valley | 56.5% | 21.4%(+0.351)#11 | 28.0%(+0.285)#2,003 |
| 12. | Panaca | 55.1% | 21.4%(+0.338)#12 | 28.0%(+0.271)#2,274 |
| 13. | Spring Creek | 54.8% | 21.4%(+0.335)#13 | 28.0%(+0.269)#2,321 |
| 14. | West Wendover | 51.5% | 21.4%(+0.301)#14 | 28.0%(+0.235)#3,095 |
| 15. | Battle Mountain | 49.9% | 21.4%(+0.285)#15 | 28.0%(+0.219)#3,529 |
| 16. | Hawthorne | 48.6% | 21.4%(+0.272)#16 | 28.0%(+0.206)#3,912 |
| 17. | Fernley | 47.0% | 21.4%(+0.257)#17 | 28.0%(+0.191)#4,406 |
| 18. | East Valley | 46.7% | 21.4%(+0.253)#18 | 28.0%(+0.187)#4,531 |
| 19. | Lovelock | 46.5% | 21.4%(+0.251)#19 | 28.0%(+0.185)#4,591 |
| 20. | Cold Springs | 44.3% | 21.4%(+0.229)#20 | 28.0%(+0.163)#5,410 |
| 21. | Boulder City | 43.9% | 21.4%(+0.225)#21 | 28.0%(+0.159)#5,570 |
| 22. | Indian Springs | 43.1% | 21.4%(+0.217)#22 | 28.0%(+0.151)#5,917 |
| 23. | Gardnerville | 42.9% | 21.4%(+0.216)#23 | 28.0%(+0.150)#5,983 |
| 24. | Elko | 42.9% | 21.4%(+0.216)#24 | 28.0%(+0.149)#5,989 |
| 25. | Washoe Valley | 39.5% | 21.4%(+0.182)#25 | 28.0%(+0.115)#7,461 |
| 26. | Wadsworth | 36.6% | 21.4%(+0.152)#26 | 28.0%(+0.086)#8,877 |
| 27. | Yerington | 36.1% | 21.4%(+0.147)#27 | 28.0%(+0.081)#9,140 |
| 28. | Gardnerville Ranchos | 35.8% | 21.4%(+0.145)#28 | 28.0%(+0.079)#9,253 |
| 29. | Schurz | 34.9% | 21.4%(+0.135)#29 | 28.0%(+0.069)#9,783 |
| 30. | Fallon | 34.7% | 21.4%(+0.133)#30 | 28.0%(+0.067)#9,880 |
| 31. | Beatty | 33.4% | 21.4%(+0.120)#31 | 28.0%(+0.054)#10,608 |
| 32. | Laughlin | 33.3% | 21.4%(+0.119)#32 | 28.0%(+0.053)#10,671 |
| 33. | Verdi | 32.9% | 21.4%(+0.115)#33 | 28.0%(+0.049)#10,874 |
| 34. | Minden | 32.6% | 21.4%(+0.112)#34 | 28.0%(+0.046)#11,032 |
| 35. | Johnson Lane | 30.1% | 21.4%(+0.087)#35 | 28.0%(+0.021)#12,370 |
| 36. | Incline Village | 29.9% | 21.4%(+0.085)#36 | 28.0%(+0.019)#12,478 |
| 37. | Mesquite | 29.7% | 21.4%(+0.084)#37 | 28.0%(+0.017)#12,556 |
| 38. | Henderson | 28.3% | 21.4%(+0.070)#38 | 28.0%(+0.004)#13,361 |
| 39. | Spanish Springs | 28.0% | 21.4%(+0.066)#39 | 28.0%(+0.000)#13,522 |
| 40. | Sparks | 27.8% | 21.4%(+0.065)#40 | 28.0%(-0.002)#13,639 |
| 41. | Owyhee | 26.4% | 21.4%(+0.050)#41 | 28.0%(-0.016)#14,439 |
| 42. | Tonopah | 25.6% | 21.4%(+0.043)#42 | 28.0%(-0.023)#14,839 |
| 43. | Pahrump | 25.5% | 21.4%(+0.042)#43 | 28.0%(-0.025)#14,914 |
| 44. | Nixon | 25.0% | 21.4%(+0.036)#44 | 28.0%(-0.030)#15,176 |
| 45. | Dayton | 24.6% | 21.4%(+0.033)#45 | 28.0%(-0.034)#15,399 |
| 46. | Topaz Ranch Estates | 24.5% | 21.4%(+0.032)#46 | 28.0%(-0.035)#15,458 |
| 47. | Lemmon Valley | 24.3% | 21.4%(+0.030)#47 | 28.0%(-0.037)#15,558 |
| 48. | Reno | 21.6% | 21.4%(+0.002)#48 | 28.0%(-0.064)#16,904 |
| 49. | Double Spring | 21.5% | 21.4%(+0.001)#49 | 28.0%(-0.065)#16,959 |
| 50. | Indian Hills | 21.3% | 21.4%(-0.000)#50 | 28.0%(-0.067)#17,034 |
| 51. | Sun Valley | 20.5% | 21.4%(-0.008)#51 | 28.0%(-0.074)#17,426 |
| 52. | Genoa | 20.2% | 21.4%(-0.012)#52 | 28.0%(-0.078)#17,603 |
| 53. | Silver Springs | 20.2% | 21.4%(-0.012)#53 | 28.0%(-0.078)#17,607 |
| 54. | Carson | 19.9% | 21.4%(-0.014)#54 | 28.0%(-0.080)#17,736 |
| 55. | Sunrise Manor | 19.3% | 21.4%(-0.020)#55 | 28.0%(-0.087)#18,028 |
| 56. | North Las Vegas | 18.8% | 21.4%(-0.026)#56 | 28.0%(-0.092)#18,252 |
| 57. | Stagecoach | 17.7% | 21.4%(-0.037)#57 | 28.0%(-0.103)#18,707 |
| 58. | Golden Valley | 17.6% | 21.4%(-0.037)#58 | 28.0%(-0.104)#18,728 |
| 59. | Stateline | 17.6% | 21.4%(-0.038)#59 | 28.0%(-0.104)#18,756 |
| 60. | Las Vegas | 17.2% | 21.4%(-0.042)#60 | 28.0%(-0.108)#18,933 |
| 61. | Walker Lake | 17.1% | 21.4%(-0.043)#61 | 28.0%(-0.109)#18,986 |
| 62. | Enterprise | 16.2% | 21.4%(-0.052)#62 | 28.0%(-0.118)#19,343 |
| 63. | Carlin | 15.6% | 21.4%(-0.057)#63 | 28.0%(-0.123)#19,576 |
| 64. | Moapa Town | 15.4% | 21.4%(-0.059)#64 | 28.0%(-0.126)#19,668 |
| 65. | Paradise | 12.6% | 21.4%(-0.088)#65 | 28.0%(-0.154)#20,648 |
| 66. | Carter Springs | 11.9% | 21.4%(-0.095)#66 | 28.0%(-0.161)#20,904 |
| 67. | Spring Valley | 11.3% | 21.4%(-0.101)#67 | 28.0%(-0.167)#21,097 |
| 68. | Whitney | 11.1% | 21.4%(-0.103)#68 | 28.0%(-0.169)#21,154 |
| 69. | Smith Valley | 11.1% | 21.4%(-0.103)#69 | 28.0%(-0.169)#21,158 |
| 70. | Winchester | 10.3% | 21.4%(-0.111)#70 | 28.0%(-0.177)#21,385 |
| 71. | Summerlin South | 9.6% | 21.4%(-0.117)#71 | 28.0%(-0.184)#21,596 |
| 72. | Ely | 8.3% | 21.4%(-0.131)#72 | 28.0%(-0.197)#22,013 |
| 73. | Jackpot | 7.7% | 21.4%(-0.137)#73 | 28.0%(-0.203)#22,196 |
| 74. | Kingsbury | 7.5% | 21.4%(-0.139)#74 | 28.0%(-0.205)#22,245 |
| 75. | Goldfield | 1.7% | 21.4%(-0.197)#75 | 28.0%(-0.263)#23,772 |
1
Common Questions
What are the Top 10 Cities with the Highest Wage/Income Gap (%) in Nevada?
Top 10 Cities with the Highest Wage/Income Gap (%) in Nevada are:
#1
86.9%
#2
80.6%
#3
78.1%
#4
77.2%
#5
70.4%
#6
67.5%
#7
64.2%
#8
60.2%
#9
58.5%
#10
56.7%
What city has the Highest Wage/Income Gap (%) in Nevada?
Crescent Valley has the Highest Wage/Income Gap (%) in Nevada with 86.9%.
What is the Wage / Income Gap in Percentage Terms in the State of Nevada?
Wage / Income Gap in Percentage Terms in Nevada is 21.4%.
What is the Wage / Income Gap in Percentage Terms in the United States?
Wage / Income Gap in Percentage Terms in the United States is 28.0%.