Cities with the Highest Wage/Income Gap (%) in New York
RELATED REPORTS & OPTIONS
Highest Wage/Income Gap (%)
New York
Compare Cities
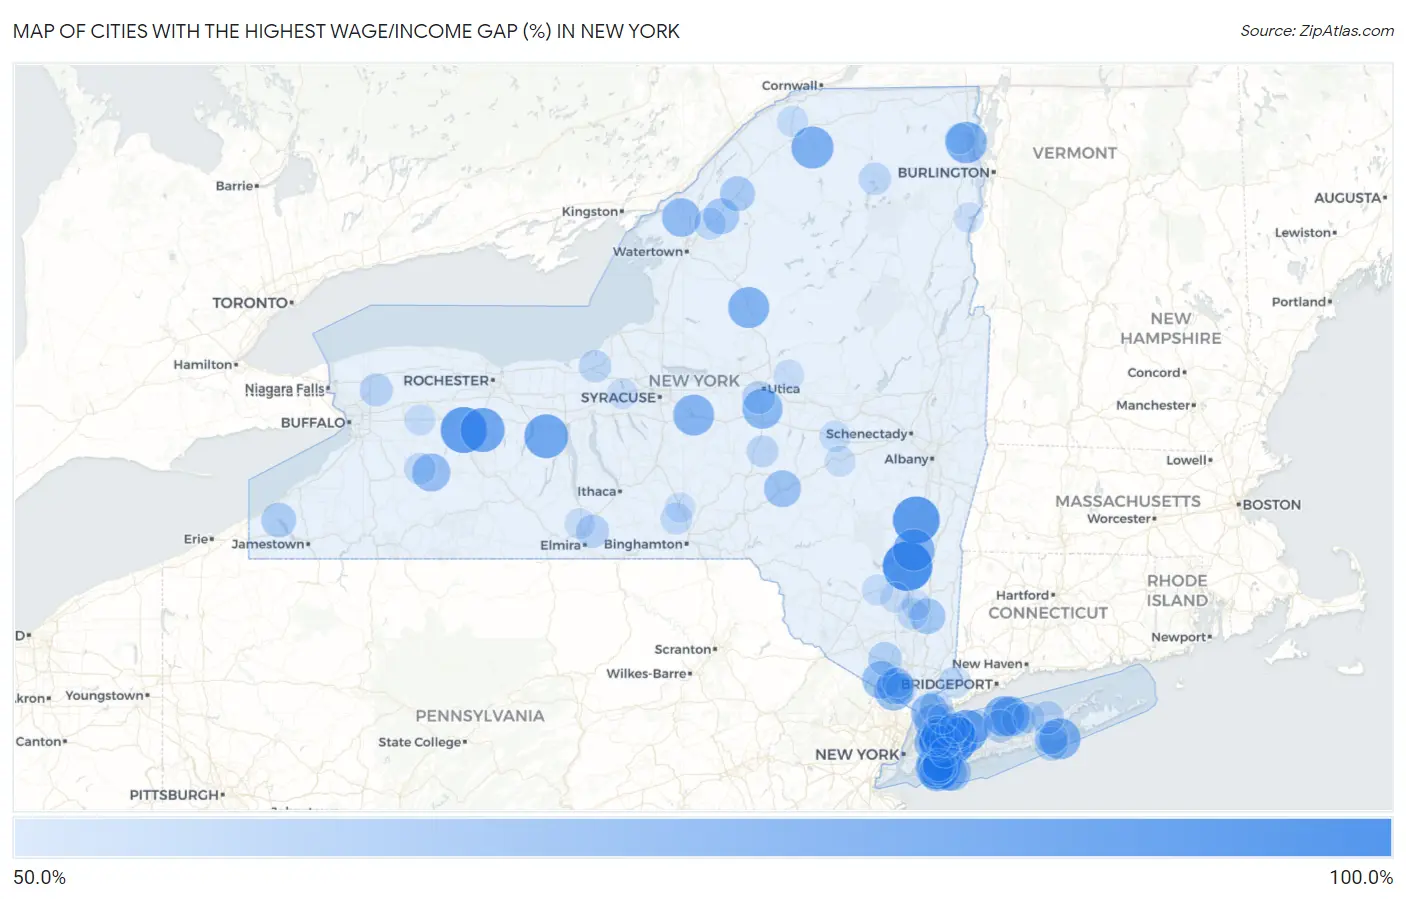
Map of Cities with the Highest Wage/Income Gap (%) in New York
0.0%
100.0%
Cities with the Highest Wage/Income Gap (%) in New York
| City | Wage/Income Gap (%) | vs State | vs National | |
| 1. | East Kingston | 93.1% | 22.6%(+0.704)#1 | 28.0%(+0.651)#52 |
| 2. | Brookville | 92.8% | 22.6%(+0.702)#2 | 28.0%(+0.649)#57 |
| 3. | Leeds | 87.9% | 22.6%(+0.653)#3 | 28.0%(+0.600)#95 |
| 4. | Retsof | 86.1% | 22.6%(+0.634)#4 | 28.0%(+0.581)#113 |
| 5. | Lakeville | 82.2% | 22.6%(+0.595)#5 | 28.0%(+0.542)#156 |
| 6. | Woodsburgh | 81.5% | 22.6%(+0.589)#6 | 28.0%(+0.535)#167 |
| 7. | Gorham | 81.2% | 22.6%(+0.586)#7 | 28.0%(+0.532)#172 |
| 8. | Munsey Park | 80.5% | 22.6%(+0.579)#8 | 28.0%(+0.526)#184 |
| 9. | Hewlett Neck | 79.9% | 22.6%(+0.573)#9 | 28.0%(+0.519)#191 |
| 10. | Cold Spring Harbor | 79.5% | 22.6%(+0.569)#10 | 28.0%(+0.516)#195 |
| 11. | Plandome Manor | 79.1% | 22.6%(+0.565)#11 | 28.0%(+0.511)#203 |
| 12. | Parishville | 77.7% | 22.6%(+0.551)#12 | 28.0%(+0.498)#223 |
| 13. | Tivoli | 77.1% | 22.6%(+0.545)#13 | 28.0%(+0.491)#242 |
| 14. | Old Westbury | 77.0% | 22.6%(+0.543)#14 | 28.0%(+0.490)#245 |
| 15. | Parc | 76.7% | 22.6%(+0.541)#15 | 28.0%(+0.487)#249 |
| 16. | Lyons Falls | 75.9% | 22.6%(+0.533)#16 | 28.0%(+0.479)#266 |
| 17. | Quiogue | 75.7% | 22.6%(+0.531)#17 | 28.0%(+0.477)#270 |
| 18. | Cazenovia | 75.3% | 22.6%(+0.527)#18 | 28.0%(+0.473)#282 |
| 19. | Old Field | 74.3% | 22.6%(+0.517)#19 | 28.0%(+0.464)#305 |
| 20. | Clayville | 73.9% | 22.6%(+0.512)#20 | 28.0%(+0.459)#328 |
| 21. | Malverne Park Oaks | 73.2% | 22.6%(+0.505)#21 | 28.0%(+0.452)#356 |
| 22. | Belle Terre | 73.2% | 22.6%(+0.505)#22 | 28.0%(+0.452)#357 |
| 23. | Glenwood Landing | 72.5% | 22.6%(+0.499)#23 | 28.0%(+0.445)#393 |
| 24. | Plandome | 72.2% | 22.6%(+0.496)#24 | 28.0%(+0.443)#407 |
| 25. | Wells Bridge | 71.4% | 22.6%(+0.487)#25 | 28.0%(+0.434)#439 |
| 26. | Great Neck Estates | 71.2% | 22.6%(+0.485)#26 | 28.0%(+0.432)#448 |
| 27. | Viola | 70.9% | 22.6%(+0.483)#27 | 28.0%(+0.429)#456 |
| 28. | La Fargeville | 70.8% | 22.6%(+0.482)#28 | 28.0%(+0.429)#459 |
| 29. | Pike | 69.8% | 22.6%(+0.472)#29 | 28.0%(+0.418)#521 |
| 30. | Scarsdale | 69.7% | 22.6%(+0.471)#30 | 28.0%(+0.417)#526 |
| 31. | East Atlantic Beach | 69.5% | 22.6%(+0.468)#31 | 28.0%(+0.415)#542 |
| 32. | Tuxedo Park | 69.4% | 22.6%(+0.468)#32 | 28.0%(+0.414)#548 |
| 33. | Oneonta | 67.6% | 22.6%(+0.450)#33 | 28.0%(+0.396)#678 |
| 34. | Roslyn Estates | 67.5% | 22.6%(+0.448)#34 | 28.0%(+0.395)#688 |
| 35. | Point Lookout | 67.3% | 22.6%(+0.446)#35 | 28.0%(+0.393)#704 |
| 36. | Wesley Hills | 67.0% | 22.6%(+0.444)#36 | 28.0%(+0.390)#719 |
| 37. | Lido Beach | 66.8% | 22.6%(+0.442)#37 | 28.0%(+0.389)#734 |
| 38. | Larchmont | 66.6% | 22.6%(+0.439)#38 | 28.0%(+0.386)#757 |
| 39. | Hewlett Bay Park | 66.4% | 22.6%(+0.438)#39 | 28.0%(+0.384)#774 |
| 40. | Antwerp | 65.6% | 22.6%(+0.430)#40 | 28.0%(+0.376)#833 |
| 41. | Hillside Lake | 65.3% | 22.6%(+0.427)#41 | 28.0%(+0.373)#857 |
| 42. | North Hills | 63.9% | 22.6%(+0.413)#42 | 28.0%(+0.359)#985 |
| 43. | Gouverneur | 63.8% | 22.6%(+0.411)#43 | 28.0%(+0.358)#1,001 |
| 44. | Hewlett Harbor | 63.7% | 22.6%(+0.411)#44 | 28.0%(+0.358)#1,006 |
| 45. | New Hackensack | 63.4% | 22.6%(+0.408)#45 | 28.0%(+0.354)#1,052 |
| 46. | Kensington | 63.4% | 22.6%(+0.407)#46 | 28.0%(+0.354)#1,056 |
| 47. | East Norwich | 63.3% | 22.6%(+0.406)#47 | 28.0%(+0.353)#1,065 |
| 48. | Mayville | 63.2% | 22.6%(+0.406)#48 | 28.0%(+0.353)#1,071 |
| 49. | Flower Hill | 62.9% | 22.6%(+0.402)#49 | 28.0%(+0.349)#1,099 |
| 50. | West Hampton Dunes | 61.5% | 22.6%(+0.389)#50 | 28.0%(+0.335)#1,274 |
| 51. | Brewster Heights | 61.5% | 22.6%(+0.389)#51 | 28.0%(+0.335)#1,276 |
| 52. | Harrison | 61.3% | 22.6%(+0.386)#52 | 28.0%(+0.333)#1,295 |
| 53. | Kiryas Joel | 61.2% | 22.6%(+0.385)#53 | 28.0%(+0.332)#1,304 |
| 54. | New Hamburg | 61.0% | 22.6%(+0.384)#54 | 28.0%(+0.331)#1,316 |
| 55. | Remsenburg Speonk | 60.9% | 22.6%(+0.382)#55 | 28.0%(+0.329)#1,333 |
| 56. | Miller Place | 60.3% | 22.6%(+0.377)#56 | 28.0%(+0.323)#1,394 |
| 57. | Lawrence | 60.2% | 22.6%(+0.376)#57 | 28.0%(+0.322)#1,406 |
| 58. | Breesport | 60.1% | 22.6%(+0.374)#58 | 28.0%(+0.321)#1,419 |
| 59. | Washington Mills | 60.0% | 22.6%(+0.374)#59 | 28.0%(+0.320)#1,423 |
| 60. | Rapids | 60.0% | 22.6%(+0.374)#60 | 28.0%(+0.320)#1,424 |
| 61. | Head Of The Harbor | 59.9% | 22.6%(+0.373)#61 | 28.0%(+0.319)#1,438 |
| 62. | Baiting Hollow | 59.9% | 22.6%(+0.372)#62 | 28.0%(+0.319)#1,443 |
| 63. | Sands Point | 59.5% | 22.6%(+0.368)#63 | 28.0%(+0.315)#1,503 |
| 64. | Centerport | 59.4% | 22.6%(+0.368)#64 | 28.0%(+0.314)#1,521 |
| 65. | Paul Smiths | 58.7% | 22.6%(+0.360)#65 | 28.0%(+0.307)#1,642 |
| 66. | Red Creek | 58.6% | 22.6%(+0.360)#66 | 28.0%(+0.306)#1,651 |
| 67. | Hewlett | 58.5% | 22.6%(+0.358)#67 | 28.0%(+0.305)#1,672 |
| 68. | Edmeston | 57.9% | 22.6%(+0.353)#68 | 28.0%(+0.300)#1,744 |
| 69. | Scotts Corners | 57.9% | 22.6%(+0.353)#69 | 28.0%(+0.299)#1,754 |
| 70. | Manorhaven | 57.8% | 22.6%(+0.352)#70 | 28.0%(+0.298)#1,768 |
| 71. | Bliss | 57.7% | 22.6%(+0.351)#71 | 28.0%(+0.297)#1,787 |
| 72. | East Hills | 57.7% | 22.6%(+0.351)#72 | 28.0%(+0.297)#1,789 |
| 73. | Great Neck | 57.6% | 22.6%(+0.350)#73 | 28.0%(+0.297)#1,799 |
| 74. | Round Top | 57.6% | 22.6%(+0.350)#74 | 28.0%(+0.296)#1,801 |
| 75. | Glen Aubrey | 57.5% | 22.6%(+0.349)#75 | 28.0%(+0.295)#1,829 |
| 76. | Philadelphia | 57.4% | 22.6%(+0.348)#76 | 28.0%(+0.295)#1,835 |
| 77. | Crown Heights | 57.3% | 22.6%(+0.346)#77 | 28.0%(+0.293)#1,862 |
| 78. | New Square | 57.2% | 22.6%(+0.346)#78 | 28.0%(+0.293)#1,868 |
| 79. | Shoreham | 57.2% | 22.6%(+0.345)#79 | 28.0%(+0.292)#1,880 |
| 80. | Matinecock | 56.7% | 22.6%(+0.340)#80 | 28.0%(+0.287)#1,964 |
| 81. | Sharon Springs | 56.5% | 22.6%(+0.338)#81 | 28.0%(+0.285)#2,004 |
| 82. | Accord | 56.2% | 22.6%(+0.336)#82 | 28.0%(+0.283)#2,049 |
| 83. | Plattsburgh West | 56.2% | 22.6%(+0.336)#83 | 28.0%(+0.282)#2,057 |
| 84. | Bard College | 56.1% | 22.6%(+0.335)#84 | 28.0%(+0.281)#2,071 |
| 85. | Norfolk | 56.0% | 22.6%(+0.334)#85 | 28.0%(+0.280)#2,100 |
| 86. | Alexander | 56.0% | 22.6%(+0.334)#86 | 28.0%(+0.280)#2,104 |
| 87. | Jordan | 55.8% | 22.6%(+0.332)#87 | 28.0%(+0.278)#2,137 |
| 88. | Richmondville | 55.8% | 22.6%(+0.331)#88 | 28.0%(+0.278)#2,152 |
| 89. | Pine Valley | 55.7% | 22.6%(+0.331)#89 | 28.0%(+0.277)#2,160 |
| 90. | Newport | 55.6% | 22.6%(+0.330)#90 | 28.0%(+0.276)#2,184 |
| 91. | Oyster Bay Cove | 55.3% | 22.6%(+0.327)#91 | 28.0%(+0.274)#2,238 |
| 92. | Pomona | 55.3% | 22.6%(+0.327)#92 | 28.0%(+0.273)#2,242 |
| 93. | Mill Neck | 55.3% | 22.6%(+0.327)#93 | 28.0%(+0.273)#2,243 |
| 94. | New Paltz | 55.3% | 22.6%(+0.326)#94 | 28.0%(+0.273)#2,253 |
| 95. | Millwood | 55.1% | 22.6%(+0.324)#95 | 28.0%(+0.271)#2,283 |
| 96. | Westport | 54.7% | 22.6%(+0.320)#96 | 28.0%(+0.267)#2,358 |
| 97. | Whitney Point | 54.7% | 22.6%(+0.320)#97 | 28.0%(+0.267)#2,360 |
| 98. | Arlington | 54.5% | 22.6%(+0.319)#98 | 28.0%(+0.265)#2,395 |
| 99. | Garden City | 54.5% | 22.6%(+0.318)#99 | 28.0%(+0.265)#2,412 |
| 100. | Rye | 54.3% | 22.6%(+0.317)#100 | 28.0%(+0.264)#2,446 |
Common Questions
What are the Top 10 Cities with the Highest Wage/Income Gap (%) in New York?
Top 10 Cities with the Highest Wage/Income Gap (%) in New York are:
#1
93.1%
#2
92.8%
#3
87.9%
#4
86.1%
#5
82.2%
#6
81.5%
#7
81.2%
#8
80.5%
#9
79.9%
#10
79.5%
What city has the Highest Wage/Income Gap (%) in New York?
East Kingston has the Highest Wage/Income Gap (%) in New York with 93.1%.
What is the Wage / Income Gap in Percentage Terms in the State of New York?
Wage / Income Gap in Percentage Terms in New York is 22.6%.
What is the Wage / Income Gap in Percentage Terms in the United States?
Wage / Income Gap in Percentage Terms in the United States is 28.0%.