Cities with the Highest Wage/Income Gap (%) in Vermont
RELATED REPORTS & OPTIONS
Highest Wage/Income Gap (%)
Vermont
Compare Cities
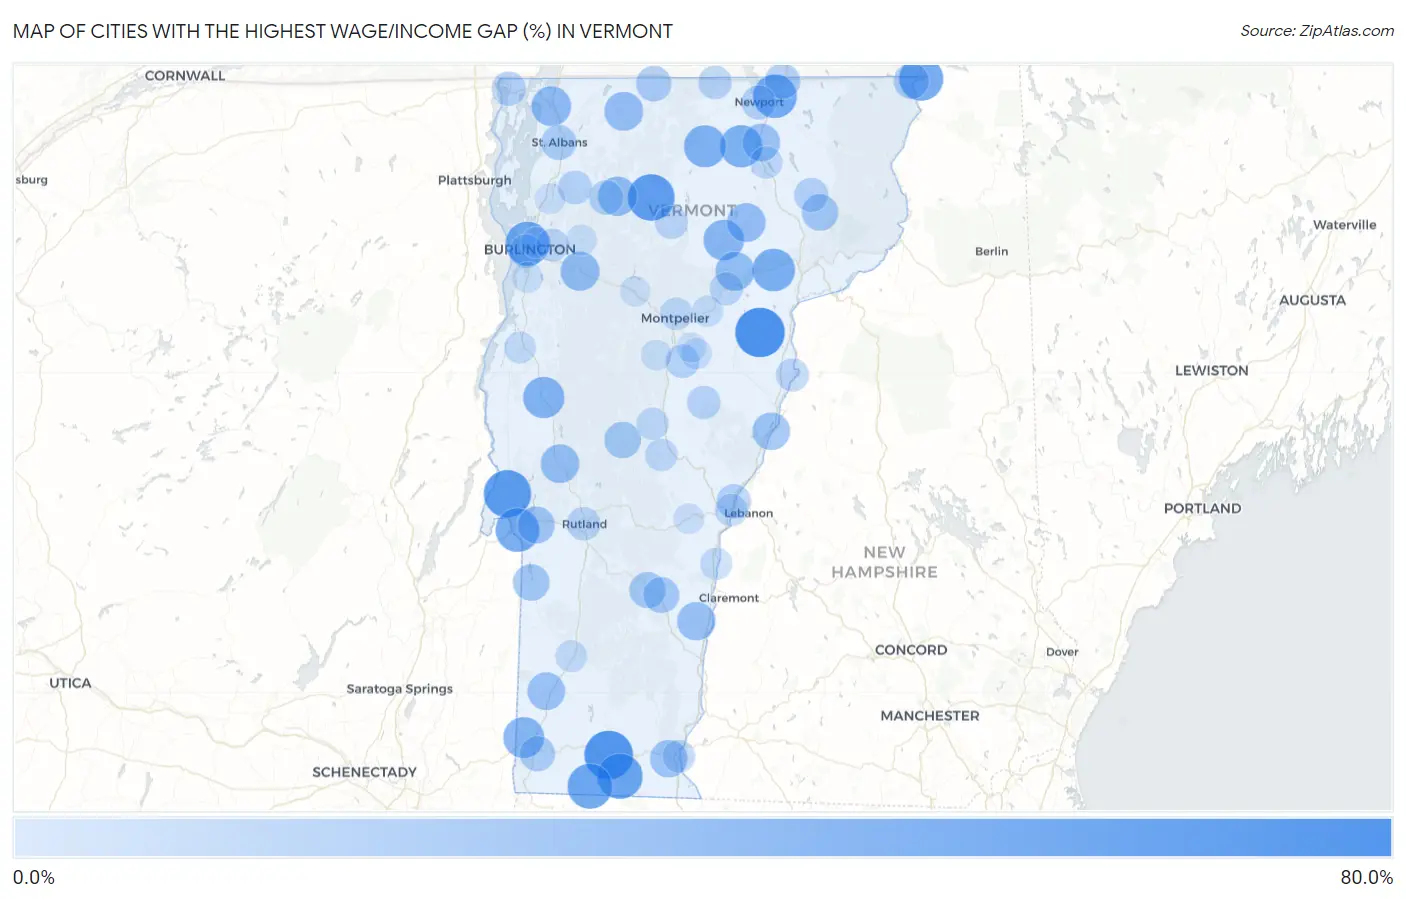
Map of Cities with the Highest Wage/Income Gap (%) in Vermont
0.0%
80.0%
Cities with the Highest Wage/Income Gap (%) in Vermont
| City | Wage/Income Gap (%) | vs State | vs National | |
| 1. | Groton | 71.3% | 18.3%(+0.530)#1 | 28.0%(+0.434)#441 |
| 2. | Wilmington | 68.1% | 18.3%(+0.498)#2 | 28.0%(+0.401)#635 |
| 3. | Benson | 63.8% | 18.3%(+0.454)#3 | 28.0%(+0.358)#1,000 |
| 4. | Johnson | 61.7% | 18.3%(+0.433)#4 | 28.0%(+0.337)#1,243 |
| 5. | Gilman | 61.0% | 18.3%(+0.426)#5 | 28.0%(+0.330)#1,322 |
| 6. | Whitingham | 58.2% | 18.3%(+0.399)#6 | 28.0%(+0.302)#1,701 |
| 7. | West Charlotte | 56.4% | 18.3%(+0.381)#7 | 28.0%(+0.285)#2,010 |
| 8. | Jacksonville | 56.4% | 18.3%(+0.380)#8 | 28.0%(+0.284)#2,026 |
| 9. | Readsboro | 55.2% | 18.3%(+0.368)#9 | 28.0%(+0.272)#2,269 |
| 10. | Lincoln | 54.5% | 18.3%(+0.361)#10 | 28.0%(+0.265)#2,403 |
| 11. | Wolcott | 52.9% | 18.3%(+0.346)#11 | 28.0%(+0.250)#2,740 |
| 12. | Burlington | 52.8% | 18.3%(+0.345)#12 | 28.0%(+0.249)#2,762 |
| 13. | Beecher Falls | 52.7% | 18.3%(+0.343)#13 | 28.0%(+0.247)#2,810 |
| 14. | Fair Haven | 51.2% | 18.3%(+0.329)#14 | 28.0%(+0.232)#3,173 |
| 15. | Derby Center | 50.9% | 18.3%(+0.325)#15 | 28.0%(+0.229)#3,257 |
| 16. | Danville | 47.7% | 18.3%(+0.293)#16 | 28.0%(+0.197)#4,207 |
| 17. | Irasburg | 46.4% | 18.3%(+0.280)#17 | 28.0%(+0.184)#4,624 |
| 18. | Lowell | 45.7% | 18.3%(+0.274)#18 | 28.0%(+0.177)#4,871 |
| 19. | Middlebury | 43.2% | 18.3%(+0.248)#19 | 28.0%(+0.152)#5,869 |
| 20. | Proctor | 42.8% | 18.3%(+0.244)#20 | 28.0%(+0.148)#6,054 |
| 21. | North Bennington | 41.7% | 18.3%(+0.233)#21 | 28.0%(+0.137)#6,511 |
| 22. | Sutton | 40.6% | 18.3%(+0.223)#22 | 28.0%(+0.127)#6,959 |
| 23. | Hardwick | 40.5% | 18.3%(+0.221)#23 | 28.0%(+0.125)#7,027 |
| 24. | Swanton | 37.7% | 18.3%(+0.193)#24 | 28.0%(+0.097)#8,296 |
| 25. | Danby | 37.0% | 18.3%(+0.186)#25 | 28.0%(+0.090)#8,679 |
| 26. | Hartford | 36.3% | 18.3%(+0.179)#26 | 28.0%(+0.083)#9,047 |
| 27. | Jeffersonville | 35.9% | 18.3%(+0.175)#27 | 28.0%(+0.079)#9,246 |
| 28. | Richmond | 35.7% | 18.3%(+0.174)#28 | 28.0%(+0.077)#9,329 |
| 29. | South Lincoln | 35.5% | 18.3%(+0.171)#29 | 28.0%(+0.075)#9,444 |
| 30. | Cabot | 35.1% | 18.3%(+0.168)#30 | 28.0%(+0.071)#9,639 |
| 31. | Huntington | 35.0% | 18.3%(+0.167)#31 | 28.0%(+0.070)#9,700 |
| 32. | Underhill Flats | 34.8% | 18.3%(+0.164)#32 | 28.0%(+0.068)#9,829 |
| 33. | Enosburg Falls | 34.7% | 18.3%(+0.163)#33 | 28.0%(+0.067)#9,898 |
| 34. | Greensboro Bend | 34.5% | 18.3%(+0.161)#34 | 28.0%(+0.065)#10,004 |
| 35. | Brandon | 33.9% | 18.3%(+0.156)#35 | 28.0%(+0.060)#10,284 |
| 36. | Springfield | 32.5% | 18.3%(+0.142)#36 | 28.0%(+0.046)#11,034 |
| 37. | East Dorset | 31.0% | 18.3%(+0.126)#37 | 28.0%(+0.030)#11,888 |
| 38. | Arlington | 30.9% | 18.3%(+0.126)#38 | 28.0%(+0.029)#11,917 |
| 39. | Orleans | 30.7% | 18.3%(+0.124)#39 | 28.0%(+0.028)#11,997 |
| 40. | Pawlet | 30.5% | 18.3%(+0.121)#40 | 28.0%(+0.025)#12,131 |
| 41. | Fairlee | 30.3% | 18.3%(+0.120)#41 | 28.0%(+0.023)#12,225 |
| 42. | Bolton Valley | 30.0% | 18.3%(+0.117)#42 | 28.0%(+0.021)#12,377 |
| 43. | North Hyde Park | 29.9% | 18.3%(+0.116)#43 | 28.0%(+0.020)#12,436 |
| 44. | West Brattleboro | 29.9% | 18.3%(+0.115)#44 | 28.0%(+0.019)#12,481 |
| 45. | Castleton | 28.6% | 18.3%(+0.102)#45 | 28.0%(+0.006)#13,240 |
| 46. | Wells | 27.2% | 18.3%(+0.089)#46 | 28.0%(-0.008)#13,983 |
| 47. | East Burke | 26.9% | 18.3%(+0.086)#47 | 28.0%(-0.010)#14,120 |
| 48. | Rochester | 26.7% | 18.3%(+0.083)#48 | 28.0%(-0.013)#14,266 |
| 49. | Bolton | 26.2% | 18.3%(+0.078)#49 | 28.0%(-0.018)#14,537 |
| 50. | Ludlow | 25.9% | 18.3%(+0.075)#50 | 28.0%(-0.021)#14,699 |
| 51. | Proctorsville | 25.1% | 18.3%(+0.068)#51 | 28.0%(-0.028)#15,110 |
| 52. | Middletown Springs | 24.5% | 18.3%(+0.062)#52 | 28.0%(-0.035)#15,465 |
| 53. | Canaan | 23.9% | 18.3%(+0.056)#53 | 28.0%(-0.041)#15,757 |
| 54. | Richford | 23.4% | 18.3%(+0.051)#54 | 28.0%(-0.046)#16,030 |
| 55. | Derby Line | 23.2% | 18.3%(+0.049)#55 | 28.0%(-0.048)#16,133 |
| 56. | Stamford | 23.0% | 18.3%(+0.046)#56 | 28.0%(-0.050)#16,271 |
| 57. | Bennington | 22.7% | 18.3%(+0.044)#57 | 28.0%(-0.053)#16,371 |
| 58. | St Albans | 21.9% | 18.3%(+0.036)#58 | 28.0%(-0.061)#16,759 |
| 59. | Killington | 21.6% | 18.3%(+0.033)#59 | 28.0%(-0.063)#16,892 |
| 60. | St. George | 20.3% | 18.3%(+0.020)#60 | 28.0%(-0.076)#17,514 |
| 61. | Cambridge | 19.8% | 18.3%(+0.015)#61 | 28.0%(-0.081)#17,777 |
| 62. | Alburgh | 19.4% | 18.3%(+0.010)#62 | 28.0%(-0.086)#18,006 |
| 63. | Wilder | 19.0% | 18.3%(+0.007)#63 | 28.0%(-0.090)#18,162 |
| 64. | Newport | 18.9% | 18.3%(+0.006)#64 | 28.0%(-0.090)#18,201 |
| 65. | West Burke | 18.9% | 18.3%(+0.005)#65 | 28.0%(-0.091)#18,214 |
| 66. | Lunenburg | 18.4% | 18.3%(+0.001)#66 | 28.0%(-0.096)#18,416 |
| 67. | Fairfax | 18.0% | 18.3%(-0.004)#67 | 28.0%(-0.100)#18,590 |
| 68. | Chittenden | 17.6% | 18.3%(-0.007)#68 | 28.0%(-0.104)#18,736 |
| 69. | Williamstown | 17.6% | 18.3%(-0.008)#69 | 28.0%(-0.104)#18,758 |
| 70. | South Burlington | 17.5% | 18.3%(-0.008)#70 | 28.0%(-0.104)#18,768 |
| 71. | Rutland | 17.3% | 18.3%(-0.011)#71 | 28.0%(-0.107)#18,891 |
| 72. | Chelsea | 16.7% | 18.3%(-0.016)#72 | 28.0%(-0.113)#19,103 |
| 73. | North Troy | 16.5% | 18.3%(-0.018)#73 | 28.0%(-0.114)#19,177 |
| 74. | Morrisville | 16.2% | 18.3%(-0.021)#74 | 28.0%(-0.117)#19,309 |
| 75. | Marshfield | 15.8% | 18.3%(-0.026)#75 | 28.0%(-0.122)#19,512 |
| 76. | West Pawlet | 15.6% | 18.3%(-0.028)#76 | 28.0%(-0.124)#19,620 |
| 77. | Newbury | 15.4% | 18.3%(-0.029)#77 | 28.0%(-0.125)#19,665 |
| 78. | Essex Junction | 14.4% | 18.3%(-0.040)#78 | 28.0%(-0.136)#20,039 |
| 79. | Brattleboro | 14.2% | 18.3%(-0.041)#79 | 28.0%(-0.138)#20,086 |
| 80. | Montpelier | 13.9% | 18.3%(-0.044)#80 | 28.0%(-0.141)#20,193 |
| 81. | Bethel | 13.8% | 18.3%(-0.046)#81 | 28.0%(-0.142)#20,229 |
| 82. | Randolph | 13.3% | 18.3%(-0.050)#82 | 28.0%(-0.147)#20,394 |
| 83. | White River Junction | 13.3% | 18.3%(-0.051)#83 | 28.0%(-0.147)#20,414 |
| 84. | Barton | 13.2% | 18.3%(-0.052)#84 | 28.0%(-0.148)#20,448 |
| 85. | Windsor | 11.8% | 18.3%(-0.065)#85 | 28.0%(-0.161)#20,909 |
| 86. | Vergennes | 11.8% | 18.3%(-0.065)#86 | 28.0%(-0.162)#20,916 |
| 87. | East Poultney | 11.5% | 18.3%(-0.068)#87 | 28.0%(-0.164)#21,017 |
| 88. | Manchester Center | 11.5% | 18.3%(-0.068)#88 | 28.0%(-0.165)#21,024 |
| 89. | Huntington Center | 10.7% | 18.3%(-0.076)#89 | 28.0%(-0.173)#21,277 |
| 90. | Harmonyville | 10.7% | 18.3%(-0.076)#90 | 28.0%(-0.173)#21,281 |
| 91. | Plainfield | 9.9% | 18.3%(-0.084)#91 | 28.0%(-0.181)#21,525 |
| 92. | Graniteville | 9.2% | 18.3%(-0.092)#92 | 28.0%(-0.188)#21,739 |
| 93. | Jericho | 8.7% | 18.3%(-0.096)#93 | 28.0%(-0.193)#21,870 |
| 94. | Milton | 8.3% | 18.3%(-0.100)#94 | 28.0%(-0.196)#21,988 |
| 95. | Shelburne | 8.2% | 18.3%(-0.102)#95 | 28.0%(-0.198)#22,038 |
| 96. | Northfield | 8.0% | 18.3%(-0.104)#96 | 28.0%(-0.200)#22,105 |
| 97. | Woodstock | 7.9% | 18.3%(-0.105)#97 | 28.0%(-0.201)#22,127 |
| 98. | Winooski | 7.5% | 18.3%(-0.108)#98 | 28.0%(-0.205)#22,244 |
| 99. | Waterbury | 7.1% | 18.3%(-0.113)#99 | 28.0%(-0.209)#22,377 |
| 100. | South Barre | 6.0% | 18.3%(-0.123)#100 | 28.0%(-0.220)#22,658 |
1
2Common Questions
What are the Top 10 Cities with the Highest Wage/Income Gap (%) in Vermont?
Top 10 Cities with the Highest Wage/Income Gap (%) in Vermont are:
#1
71.3%
#2
68.1%
#3
63.8%
#4
61.7%
#5
56.4%
#6
55.2%
#7
52.8%
#8
52.7%
#9
51.2%
#10
50.9%
What city has the Highest Wage/Income Gap (%) in Vermont?
Groton has the Highest Wage/Income Gap (%) in Vermont with 71.3%.
What is the Wage / Income Gap in Percentage Terms in the State of Vermont?
Wage / Income Gap in Percentage Terms in Vermont is 18.3%.
What is the Wage / Income Gap in Percentage Terms in the United States?
Wage / Income Gap in Percentage Terms in the United States is 28.0%.