Cities with the Highest Wage/Income Gap (%) in Indiana
RELATED REPORTS & OPTIONS
Highest Wage/Income Gap (%)
Indiana
Compare Cities
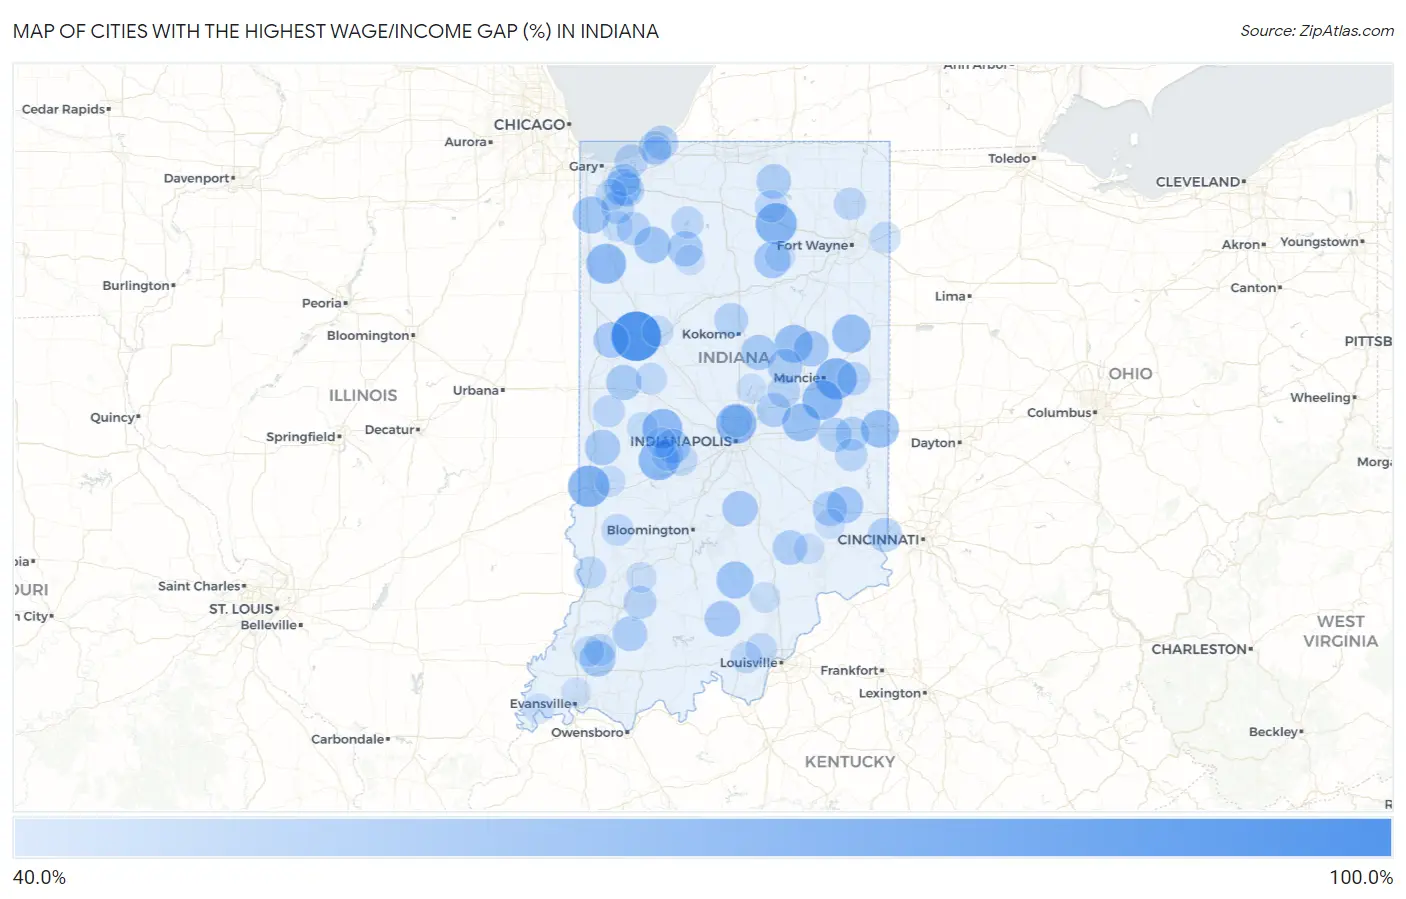
Map of Cities with the Highest Wage/Income Gap (%) in Indiana
0.0%
100.0%
Cities with the Highest Wage/Income Gap (%) in Indiana
| City | Wage/Income Gap (%) | vs State | vs National | |
| 1. | Needmore | 93.9% | 30.9%(+0.629)#1 | 28.0%(+0.659)#42 |
| 2. | Montmorenci | 91.6% | 30.9%(+0.607)#2 | 28.0%(+0.636)#68 |
| 3. | Libertyville | 76.4% | 30.9%(+0.455)#3 | 28.0%(+0.484)#255 |
| 4. | West Terre Haute | 72.8% | 30.9%(+0.419)#4 | 28.0%(+0.448)#379 |
| 5. | Selma | 72.5% | 30.9%(+0.416)#5 | 28.0%(+0.445)#394 |
| 6. | Celestine | 72.4% | 30.9%(+0.414)#6 | 28.0%(+0.444)#401 |
| 7. | Winona Lake | 72.3% | 30.9%(+0.414)#7 | 28.0%(+0.443)#404 |
| 8. | Judah | 72.0% | 30.9%(+0.411)#8 | 28.0%(+0.440)#417 |
| 9. | Hobbs | 72.0% | 30.9%(+0.410)#9 | 28.0%(+0.440)#424 |
| 10. | Greencastle | 70.4% | 30.9%(+0.394)#10 | 28.0%(+0.424)#492 |
| 11. | Tyner | 70.0% | 30.9%(+0.391)#11 | 28.0%(+0.421)#501 |
| 12. | Meridian Hills | 69.6% | 30.9%(+0.386)#12 | 28.0%(+0.416)#536 |
| 13. | Springport | 69.3% | 30.9%(+0.384)#13 | 28.0%(+0.413)#559 |
| 14. | Roachdale | 69.2% | 30.9%(+0.383)#14 | 28.0%(+0.413)#564 |
| 15. | Mount Ayr | 68.9% | 30.9%(+0.380)#15 | 28.0%(+0.409)#586 |
| 16. | Everton | 66.2% | 30.9%(+0.352)#16 | 28.0%(+0.382)#792 |
| 17. | Pennville | 65.2% | 30.9%(+0.342)#17 | 28.0%(+0.372)#871 |
| 18. | Fairmount | 65.0% | 30.9%(+0.341)#18 | 28.0%(+0.370)#887 |
| 19. | Spring Grove | 64.8% | 30.9%(+0.339)#19 | 28.0%(+0.369)#901 |
| 20. | Shirley | 64.8% | 30.9%(+0.339)#20 | 28.0%(+0.368)#910 |
| 21. | Medora | 62.9% | 30.9%(+0.320)#21 | 28.0%(+0.349)#1,097 |
| 22. | Lowell | 62.4% | 30.9%(+0.315)#22 | 28.0%(+0.344)#1,162 |
| 23. | Oakville | 62.1% | 30.9%(+0.312)#23 | 28.0%(+0.342)#1,192 |
| 24. | Medaryville | 61.8% | 30.9%(+0.308)#24 | 28.0%(+0.338)#1,229 |
| 25. | Laketon | 61.6% | 30.9%(+0.307)#25 | 28.0%(+0.336)#1,258 |
| 26. | Shorewood Forest | 61.5% | 30.9%(+0.306)#26 | 28.0%(+0.335)#1,271 |
| 27. | Oldenburg | 61.5% | 30.9%(+0.306)#27 | 28.0%(+0.335)#1,275 |
| 28. | Somerville | 60.4% | 30.9%(+0.295)#28 | 28.0%(+0.324)#1,385 |
| 29. | Livonia | 60.0% | 30.9%(+0.291)#29 | 28.0%(+0.320)#1,427 |
| 30. | Pine Village | 59.4% | 30.9%(+0.285)#30 | 28.0%(+0.314)#1,520 |
| 31. | Cordry Sweetwater Lakes | 59.4% | 30.9%(+0.285)#31 | 28.0%(+0.314)#1,525 |
| 32. | Matthews | 59.4% | 30.9%(+0.285)#32 | 28.0%(+0.314)#1,526 |
| 33. | Hessen Cassel | 59.3% | 30.9%(+0.284)#33 | 28.0%(+0.313)#1,535 |
| 34. | Mecca | 59.2% | 30.9%(+0.283)#34 | 28.0%(+0.312)#1,561 |
| 35. | Winamac | 59.0% | 30.9%(+0.281)#35 | 28.0%(+0.311)#1,584 |
| 36. | Windfall City | 58.9% | 30.9%(+0.280)#36 | 28.0%(+0.309)#1,608 |
| 37. | Wellsboro | 58.6% | 30.9%(+0.277)#37 | 28.0%(+0.306)#1,655 |
| 38. | Mellott | 58.6% | 30.9%(+0.276)#38 | 28.0%(+0.306)#1,660 |
| 39. | Orestes | 58.3% | 30.9%(+0.274)#39 | 28.0%(+0.303)#1,694 |
| 40. | Servia | 58.2% | 30.9%(+0.273)#40 | 28.0%(+0.302)#1,708 |
| 41. | Westwood | 58.1% | 30.9%(+0.272)#41 | 28.0%(+0.301)#1,721 |
| 42. | Stanford | 57.9% | 30.9%(+0.270)#42 | 28.0%(+0.300)#1,746 |
| 43. | Heritage Lake | 57.8% | 30.9%(+0.269)#43 | 28.0%(+0.299)#1,766 |
| 44. | New Point | 57.6% | 30.9%(+0.266)#44 | 28.0%(+0.296)#1,817 |
| 45. | New Paris | 57.5% | 30.9%(+0.266)#45 | 28.0%(+0.295)#1,819 |
| 46. | Country Squire Lakes | 57.5% | 30.9%(+0.266)#46 | 28.0%(+0.295)#1,825 |
| 47. | Otwell | 57.5% | 30.9%(+0.266)#47 | 28.0%(+0.295)#1,828 |
| 48. | Greendale | 56.7% | 30.9%(+0.258)#48 | 28.0%(+0.287)#1,958 |
| 49. | Ingalls | 56.4% | 30.9%(+0.255)#49 | 28.0%(+0.284)#2,019 |
| 50. | Ardmore | 56.3% | 30.9%(+0.253)#50 | 28.0%(+0.283)#2,046 |
| 51. | Galveston | 56.1% | 30.9%(+0.251)#51 | 28.0%(+0.281)#2,083 |
| 52. | East Germantown | 55.7% | 30.9%(+0.248)#52 | 28.0%(+0.277)#2,158 |
| 53. | Michiana Shores | 55.6% | 30.9%(+0.247)#53 | 28.0%(+0.276)#2,180 |
| 54. | Straughn | 55.6% | 30.9%(+0.246)#54 | 28.0%(+0.276)#2,190 |
| 55. | Wheatfield | 55.2% | 30.9%(+0.243)#55 | 28.0%(+0.272)#2,265 |
| 56. | Aberdeen | 55.1% | 30.9%(+0.241)#56 | 28.0%(+0.271)#2,284 |
| 57. | Farmland | 54.6% | 30.9%(+0.237)#57 | 28.0%(+0.267)#2,365 |
| 58. | Cannelburg | 54.5% | 30.9%(+0.236)#58 | 28.0%(+0.265)#2,401 |
| 59. | Porter | 54.3% | 30.9%(+0.234)#59 | 28.0%(+0.264)#2,439 |
| 60. | Pottawattamie Park | 54.3% | 30.9%(+0.234)#60 | 28.0%(+0.263)#2,457 |
| 61. | Hebron | 54.0% | 30.9%(+0.231)#61 | 28.0%(+0.260)#2,528 |
| 62. | Edgewood | 53.6% | 30.9%(+0.227)#62 | 28.0%(+0.256)#2,607 |
| 63. | Salt Creek Commons | 53.1% | 30.9%(+0.222)#63 | 28.0%(+0.251)#2,703 |
| 64. | Williams Creek | 52.9% | 30.9%(+0.220)#64 | 28.0%(+0.249)#2,750 |
| 65. | Connersville | 52.9% | 30.9%(+0.220)#65 | 28.0%(+0.249)#2,757 |
| 66. | Leesburg | 52.7% | 30.9%(+0.218)#66 | 28.0%(+0.247)#2,793 |
| 67. | Altona | 52.6% | 30.9%(+0.217)#67 | 28.0%(+0.246)#2,814 |
| 68. | Poland | 52.3% | 30.9%(+0.214)#68 | 28.0%(+0.243)#2,900 |
| 69. | Oakland City | 52.1% | 30.9%(+0.212)#69 | 28.0%(+0.241)#2,954 |
| 70. | Bass Lake | 52.1% | 30.9%(+0.212)#70 | 28.0%(+0.241)#2,957 |
| 71. | Oaktown | 51.9% | 30.9%(+0.210)#71 | 28.0%(+0.239)#2,997 |
| 72. | Kingman | 51.8% | 30.9%(+0.209)#72 | 28.0%(+0.239)#3,019 |
| 73. | Winfield | 51.5% | 30.9%(+0.206)#73 | 28.0%(+0.235)#3,088 |
| 74. | Jasonville | 51.4% | 30.9%(+0.205)#74 | 28.0%(+0.235)#3,110 |
| 75. | Stilesville | 51.4% | 30.9%(+0.205)#75 | 28.0%(+0.234)#3,124 |
| 76. | Fillmore | 51.2% | 30.9%(+0.203)#76 | 28.0%(+0.233)#3,158 |
| 77. | Linden | 51.1% | 30.9%(+0.201)#77 | 28.0%(+0.231)#3,211 |
| 78. | Galena | 50.9% | 30.9%(+0.200)#78 | 28.0%(+0.230)#3,236 |
| 79. | Crandall | 50.8% | 30.9%(+0.199)#79 | 28.0%(+0.229)#3,263 |
| 80. | Woodburn | 50.3% | 30.9%(+0.193)#80 | 28.0%(+0.223)#3,421 |
| 81. | Battle Ground | 50.2% | 30.9%(+0.193)#81 | 28.0%(+0.222)#3,443 |
| 82. | Underwood | 49.9% | 30.9%(+0.190)#82 | 28.0%(+0.220)#3,515 |
| 83. | Wooster | 49.8% | 30.9%(+0.189)#83 | 28.0%(+0.219)#3,540 |
| 84. | Seelyville | 49.6% | 30.9%(+0.187)#84 | 28.0%(+0.216)#3,604 |
| 85. | Francisco | 49.5% | 30.9%(+0.186)#85 | 28.0%(+0.216)#3,613 |
| 86. | Russellville | 49.5% | 30.9%(+0.186)#86 | 28.0%(+0.215)#3,633 |
| 87. | De Motte | 49.4% | 30.9%(+0.185)#87 | 28.0%(+0.215)#3,642 |
| 88. | Odon | 49.0% | 30.9%(+0.181)#88 | 28.0%(+0.210)#3,776 |
| 89. | Little York | 48.9% | 30.9%(+0.180)#89 | 28.0%(+0.209)#3,805 |
| 90. | North Manchester | 48.7% | 30.9%(+0.178)#90 | 28.0%(+0.207)#3,867 |
| 91. | Butlerville | 48.2% | 30.9%(+0.173)#91 | 28.0%(+0.202)#4,018 |
| 92. | Bainbridge | 48.2% | 30.9%(+0.173)#92 | 28.0%(+0.202)#4,029 |
| 93. | Star City | 48.2% | 30.9%(+0.172)#93 | 28.0%(+0.202)#4,038 |
| 94. | Napoleon | 48.1% | 30.9%(+0.172)#94 | 28.0%(+0.201)#4,060 |
| 95. | Mount Vernon | 47.9% | 30.9%(+0.170)#95 | 28.0%(+0.200)#4,115 |
| 96. | Cicero | 47.9% | 30.9%(+0.170)#96 | 28.0%(+0.199)#4,133 |
| 97. | Highland | 47.6% | 30.9%(+0.167)#97 | 28.0%(+0.196)#4,224 |
| 98. | Trail Creek | 47.5% | 30.9%(+0.166)#98 | 28.0%(+0.195)#4,260 |
| 99. | Mongo | 47.4% | 30.9%(+0.165)#99 | 28.0%(+0.195)#4,268 |
| 100. | Lyford | 47.3% | 30.9%(+0.164)#100 | 28.0%(+0.193)#4,328 |
Common Questions
What are the Top 10 Cities with the Highest Wage/Income Gap (%) in Indiana?
Top 10 Cities with the Highest Wage/Income Gap (%) in Indiana are:
#1
91.6%
#2
72.8%
#3
72.5%
#4
72.3%
#5
70.4%
#6
69.6%
#7
69.3%
#8
69.2%
#9
68.9%
#10
65.2%
What city has the Highest Wage/Income Gap (%) in Indiana?
Montmorenci has the Highest Wage/Income Gap (%) in Indiana with 91.6%.
What is the Wage / Income Gap in Percentage Terms in the State of Indiana?
Wage / Income Gap in Percentage Terms in Indiana is 30.9%.
What is the Wage / Income Gap in Percentage Terms in the United States?
Wage / Income Gap in Percentage Terms in the United States is 28.0%.