Cities with the Highest Wage/Income Gap (%) in Delaware
RELATED REPORTS & OPTIONS
Highest Wage/Income Gap (%)
Delaware
Compare Cities
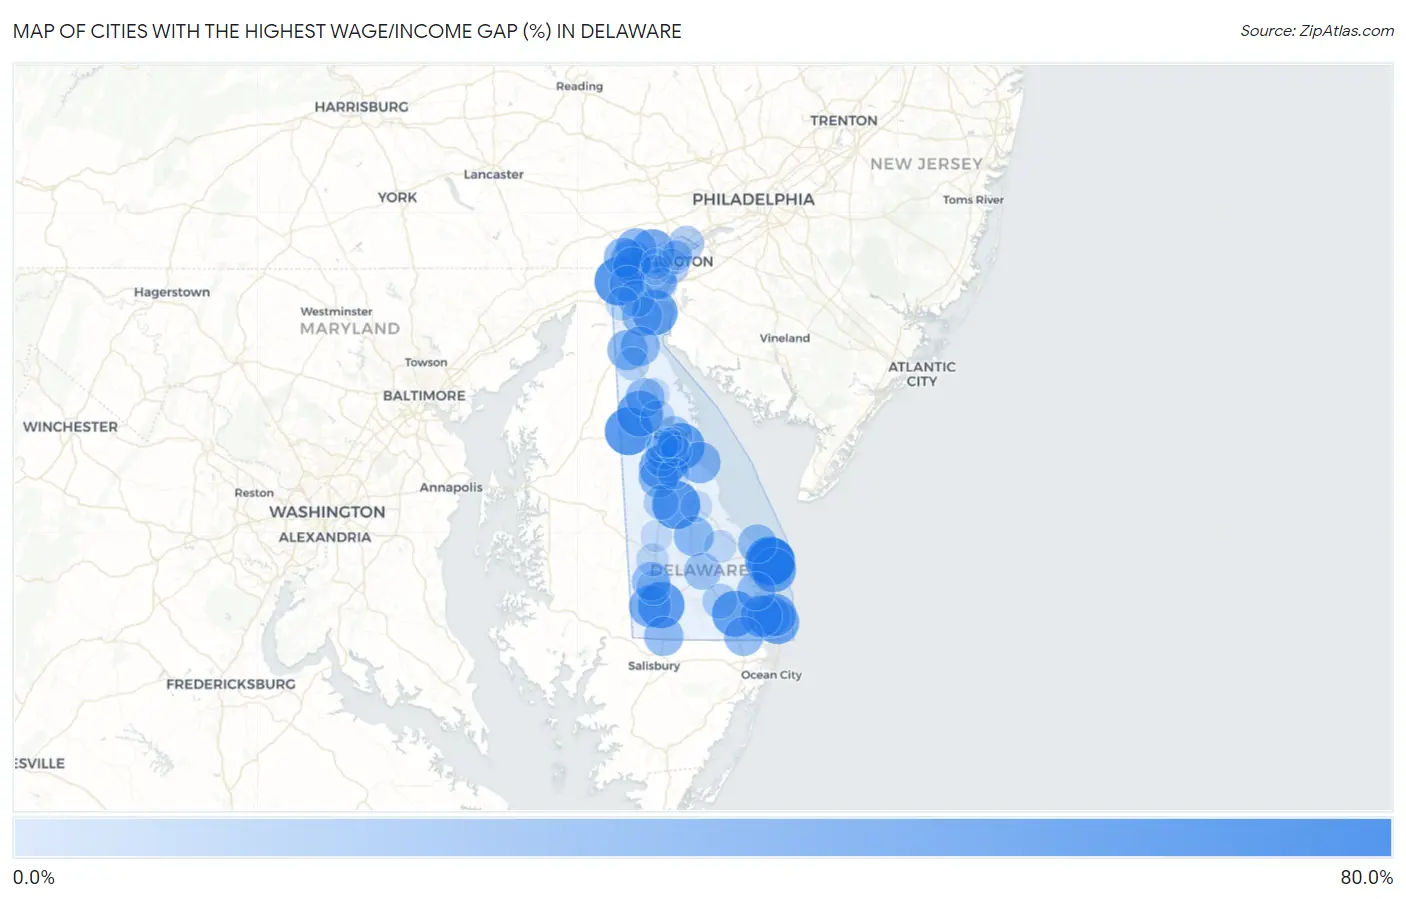
Map of Cities with the Highest Wage/Income Gap (%) in Delaware
0.0%
80.0%
Cities with the Highest Wage/Income Gap (%) in Delaware
| City | Wage/Income Gap (%) | vs State | vs National | |
| 1. | Rehoboth Beach | 65.3% | 24.3%(+0.410)#1 | 28.0%(+0.374)#851 |
| 2. | Newark | 61.7% | 24.3%(+0.374)#2 | 28.0%(+0.337)#1,237 |
| 3. | Houston | 60.2% | 24.3%(+0.359)#3 | 28.0%(+0.323)#1,401 |
| 4. | Hartly | 59.7% | 24.3%(+0.354)#4 | 28.0%(+0.317)#1,461 |
| 5. | Henlopen Acres | 58.8% | 24.3%(+0.345)#5 | 28.0%(+0.308)#1,622 |
| 6. | Laurel | 55.6% | 24.3%(+0.313)#6 | 28.0%(+0.276)#2,185 |
| 7. | Dover Base Housing | 55.5% | 24.3%(+0.312)#7 | 28.0%(+0.276)#2,196 |
| 8. | Kenton | 54.0% | 24.3%(+0.297)#8 | 28.0%(+0.260)#2,519 |
| 9. | Dagsboro | 53.9% | 24.3%(+0.295)#9 | 28.0%(+0.259)#2,554 |
| 10. | Delaware City | 51.6% | 24.3%(+0.273)#10 | 28.0%(+0.236)#3,080 |
| 11. | Dewey Beach | 49.3% | 24.3%(+0.250)#11 | 28.0%(+0.213)#3,684 |
| 12. | Viola | 48.6% | 24.3%(+0.242)#12 | 28.0%(+0.206)#3,916 |
| 13. | Greenville | 47.5% | 24.3%(+0.232)#13 | 28.0%(+0.196)#4,247 |
| 14. | South Bethany | 45.6% | 24.3%(+0.213)#14 | 28.0%(+0.176)#4,915 |
| 15. | Ocean View | 43.8% | 24.3%(+0.195)#15 | 28.0%(+0.158)#5,621 |
| 16. | Bethany Beach | 43.5% | 24.3%(+0.191)#16 | 28.0%(+0.155)#5,749 |
| 17. | Bethel | 40.8% | 24.3%(+0.165)#17 | 28.0%(+0.128)#6,881 |
| 18. | Millville | 40.2% | 24.3%(+0.159)#18 | 28.0%(+0.122)#7,142 |
| 19. | Woodside East | 38.6% | 24.3%(+0.143)#19 | 28.0%(+0.106)#7,869 |
| 20. | Bowers | 38.6% | 24.3%(+0.143)#20 | 28.0%(+0.106)#7,870 |
| 21. | Pike Creek | 37.2% | 24.3%(+0.129)#21 | 28.0%(+0.092)#8,570 |
| 22. | Hockessin | 36.9% | 24.3%(+0.126)#22 | 28.0%(+0.089)#8,727 |
| 23. | Middletown | 35.1% | 24.3%(+0.108)#23 | 28.0%(+0.071)#9,646 |
| 24. | Felton | 34.6% | 24.3%(+0.102)#24 | 28.0%(+0.066)#9,957 |
| 25. | Ellendale | 34.4% | 24.3%(+0.101)#25 | 28.0%(+0.064)#10,030 |
| 26. | North Star | 33.2% | 24.3%(+0.088)#26 | 28.0%(+0.052)#10,716 |
| 27. | St Georges | 33.0% | 24.3%(+0.086)#27 | 28.0%(+0.050)#10,822 |
| 28. | Odessa | 32.8% | 24.3%(+0.085)#28 | 28.0%(+0.048)#10,901 |
| 29. | Delmar | 32.1% | 24.3%(+0.078)#29 | 28.0%(+0.041)#11,287 |
| 30. | Selbyville | 31.4% | 24.3%(+0.071)#30 | 28.0%(+0.034)#11,671 |
| 31. | Wilmington Manor | 31.1% | 24.3%(+0.068)#31 | 28.0%(+0.031)#11,812 |
| 32. | Clayton | 30.8% | 24.3%(+0.065)#32 | 28.0%(+0.028)#11,955 |
| 33. | Lewes | 30.4% | 24.3%(+0.061)#33 | 28.0%(+0.024)#12,155 |
| 34. | Seaford | 29.5% | 24.3%(+0.052)#34 | 28.0%(+0.015)#12,690 |
| 35. | Long Neck | 29.5% | 24.3%(+0.052)#35 | 28.0%(+0.015)#12,714 |
| 36. | Pike Creek Valley | 28.8% | 24.3%(+0.045)#36 | 28.0%(+0.008)#13,121 |
| 37. | Dover | 26.5% | 24.3%(+0.021)#37 | 28.0%(-0.015)#14,388 |
| 38. | Camden | 25.1% | 24.3%(+0.007)#38 | 28.0%(-0.029)#15,147 |
| 39. | Georgetown | 24.9% | 24.3%(+0.006)#39 | 28.0%(-0.031)#15,240 |
| 40. | Bear | 24.4% | 24.3%(+0.000)#40 | 28.0%(-0.036)#15,535 |
| 41. | Brookside | 21.6% | 24.3%(-0.027)#41 | 28.0%(-0.063)#16,890 |
| 42. | Claymont | 20.4% | 24.3%(-0.039)#42 | 28.0%(-0.075)#17,466 |
| 43. | Wilmington | 19.3% | 24.3%(-0.050)#43 | 28.0%(-0.086)#18,016 |
| 44. | Harrington | 18.6% | 24.3%(-0.058)#44 | 28.0%(-0.094)#18,357 |
| 45. | Blades | 18.4% | 24.3%(-0.059)#45 | 28.0%(-0.096)#18,410 |
| 46. | Millsboro | 18.3% | 24.3%(-0.060)#46 | 28.0%(-0.096)#18,445 |
| 47. | Cheswold | 16.0% | 24.3%(-0.083)#47 | 28.0%(-0.120)#19,419 |
| 48. | Edgemoor | 14.8% | 24.3%(-0.095)#48 | 28.0%(-0.131)#19,873 |
| 49. | Glasgow | 13.8% | 24.3%(-0.106)#49 | 28.0%(-0.142)#20,239 |
| 50. | Woodside | 13.6% | 24.3%(-0.108)#50 | 28.0%(-0.144)#20,313 |
| 51. | Townsend | 12.5% | 24.3%(-0.118)#51 | 28.0%(-0.155)#20,668 |
| 52. | Bridgeville | 11.4% | 24.3%(-0.130)#52 | 28.0%(-0.166)#21,071 |
| 53. | Milton | 10.3% | 24.3%(-0.140)#53 | 28.0%(-0.177)#21,399 |
| 54. | New Castle | 9.4% | 24.3%(-0.149)#54 | 28.0%(-0.186)#21,673 |
| 55. | Highland Acres | 9.1% | 24.3%(-0.152)#55 | 28.0%(-0.188)#21,757 |
| 56. | Greenwood | 8.2% | 24.3%(-0.161)#56 | 28.0%(-0.198)#22,029 |
| 57. | Smyrna | 8.1% | 24.3%(-0.163)#57 | 28.0%(-0.199)#22,073 |
| 58. | Milford | 8.0% | 24.3%(-0.164)#58 | 28.0%(-0.200)#22,108 |
| 59. | Riverview | 7.3% | 24.3%(-0.170)#59 | 28.0%(-0.207)#22,304 |
| 60. | Kent Acres | 6.8% | 24.3%(-0.176)#60 | 28.0%(-0.212)#22,461 |
| 61. | Wyoming | 6.0% | 24.3%(-0.183)#61 | 28.0%(-0.220)#22,656 |
| 62. | Elsmere | 5.6% | 24.3%(-0.187)#62 | 28.0%(-0.224)#22,749 |
| 63. | Rising Sun Lebanon | 5.0% | 24.3%(-0.193)#63 | 28.0%(-0.229)#22,921 |
| 64. | Bellefonte | 3.8% | 24.3%(-0.205)#64 | 28.0%(-0.242)#23,234 |
| 65. | Rodney Village | 2.6% | 24.3%(-0.218)#65 | 28.0%(-0.254)#23,544 |
| 66. | Newport | 2.5% | 24.3%(-0.218)#66 | 28.0%(-0.254)#23,547 |
1
Common Questions
What are the Top 10 Cities with the Highest Wage/Income Gap (%) in Delaware?
Top 10 Cities with the Highest Wage/Income Gap (%) in Delaware are:
#1
65.3%
#2
61.7%
#3
60.2%
#4
59.7%
#5
58.8%
#6
55.6%
#7
55.5%
#8
54.0%
#9
53.9%
#10
51.6%
What city has the Highest Wage/Income Gap (%) in Delaware?
Rehoboth Beach has the Highest Wage/Income Gap (%) in Delaware with 65.3%.
What is the Wage / Income Gap in Percentage Terms in the State of Delaware?
Wage / Income Gap in Percentage Terms in Delaware is 24.3%.
What is the Wage / Income Gap in Percentage Terms in the United States?
Wage / Income Gap in Percentage Terms in the United States is 28.0%.