Cities with the Highest Wage/Income Gap (%) in Iowa
RELATED REPORTS & OPTIONS
Highest Wage/Income Gap (%)
Iowa
Compare Cities
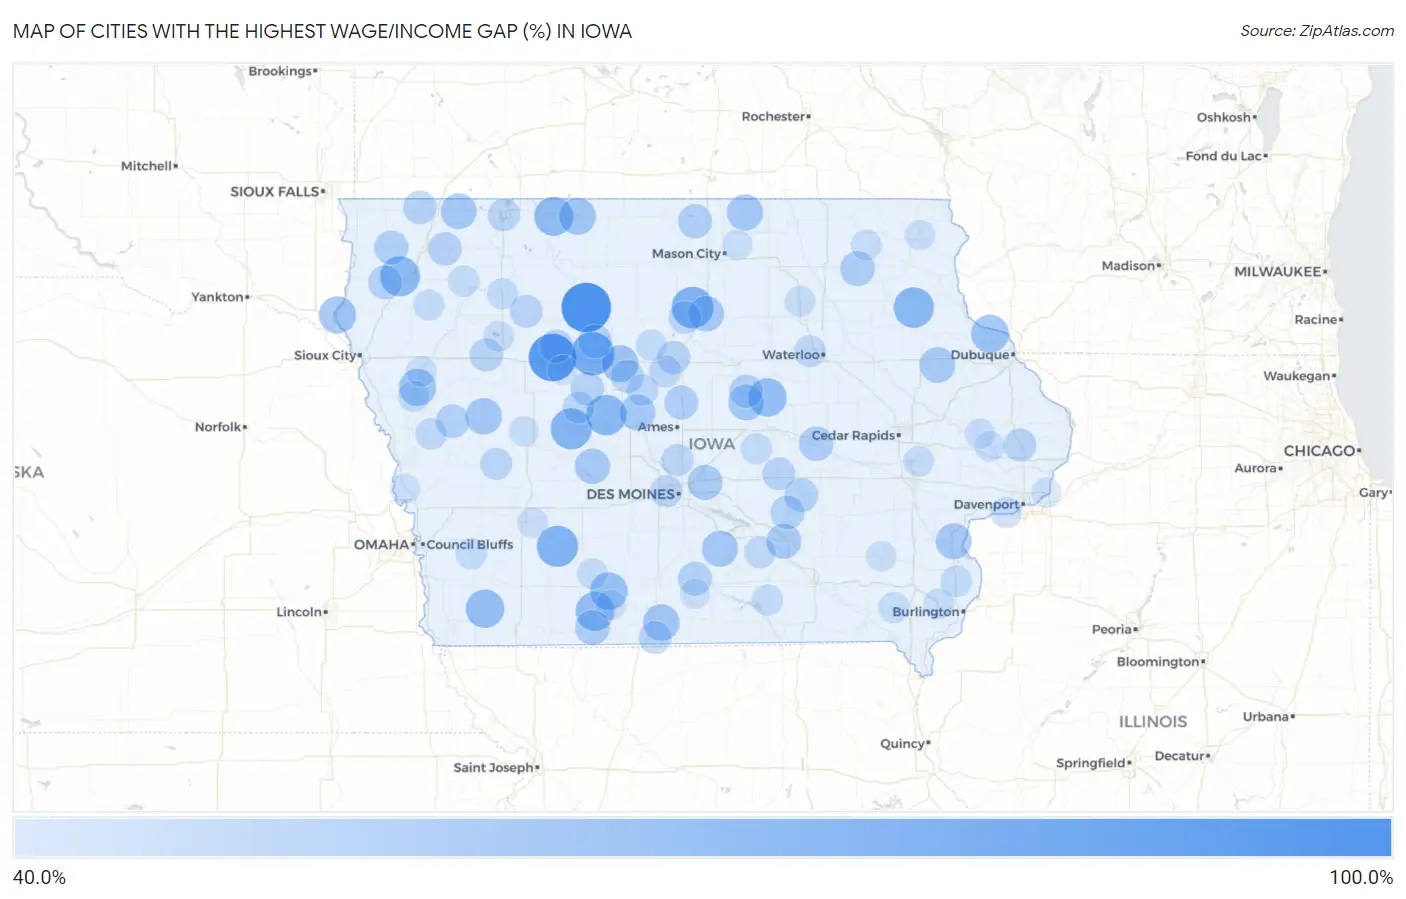
Map of Cities with the Highest Wage/Income Gap (%) in Iowa
0.0%
100.0%
Cities with the Highest Wage/Income Gap (%) in Iowa
| City | Wage/Income Gap (%) | vs State | vs National | |
| 1. | Bradgate | 91.1% | 29.9%(+0.611)#1 | 28.0%(+0.631)#74 |
| 2. | Jolley | 86.7% | 29.9%(+0.568)#2 | 28.0%(+0.587)#110 |
| 3. | Barnum | 77.7% | 29.9%(+0.478)#3 | 28.0%(+0.498)#225 |
| 4. | Alexander | 73.9% | 29.9%(+0.440)#4 | 28.0%(+0.459)#323 |
| 5. | Bridgewater | 73.0% | 29.9%(+0.431)#5 | 28.0%(+0.450)#365 |
| 6. | Scranton | 72.7% | 29.9%(+0.428)#6 | 28.0%(+0.448)#380 |
| 7. | Dana | 71.5% | 29.9%(+0.416)#7 | 28.0%(+0.435)#436 |
| 8. | Volga | 71.1% | 29.9%(+0.412)#8 | 28.0%(+0.432)#449 |
| 9. | Orange City | 70.5% | 29.9%(+0.406)#9 | 28.0%(+0.425)#483 |
| 10. | Gruver | 68.4% | 29.9%(+0.385)#10 | 28.0%(+0.404)#617 |
| 11. | Diagonal | 67.7% | 29.9%(+0.378)#11 | 28.0%(+0.397)#673 |
| 12. | Essex | 67.4% | 29.9%(+0.375)#12 | 28.0%(+0.394)#695 |
| 13. | Beaman | 66.8% | 29.9%(+0.369)#13 | 28.0%(+0.388)#740 |
| 14. | Arispe | 65.8% | 29.9%(+0.359)#14 | 28.0%(+0.378)#817 |
| 15. | Balltown | 65.7% | 29.9%(+0.358)#15 | 28.0%(+0.377)#824 |
| 16. | Oto | 64.4% | 29.9%(+0.345)#16 | 28.0%(+0.364)#937 |
| 17. | Westfield | 64.3% | 29.9%(+0.344)#17 | 28.0%(+0.363)#942 |
| 18. | Coalville | 64.0% | 29.9%(+0.341)#18 | 28.0%(+0.361)#970 |
| 19. | Armstrong | 64.0% | 29.9%(+0.341)#19 | 28.0%(+0.360)#974 |
| 20. | Leon | 62.9% | 29.9%(+0.330)#20 | 28.0%(+0.350)#1,091 |
| 21. | Deloit | 62.6% | 29.9%(+0.327)#21 | 28.0%(+0.346)#1,137 |
| 22. | Carpenter | 62.4% | 29.9%(+0.325)#22 | 28.0%(+0.345)#1,160 |
| 23. | Melcher Dallas | 62.0% | 29.9%(+0.321)#23 | 28.0%(+0.340)#1,199 |
| 24. | Grandview | 61.8% | 29.9%(+0.319)#24 | 28.0%(+0.338)#1,218 |
| 25. | Ocheyedan | 61.6% | 29.9%(+0.317)#25 | 28.0%(+0.336)#1,254 |
| 26. | Fraser | 61.6% | 29.9%(+0.317)#26 | 28.0%(+0.336)#1,259 |
| 27. | Liscomb | 61.4% | 29.9%(+0.315)#27 | 28.0%(+0.334)#1,287 |
| 28. | Delhi | 61.2% | 29.9%(+0.313)#28 | 28.0%(+0.332)#1,301 |
| 29. | Latimer | 61.0% | 29.9%(+0.311)#29 | 28.0%(+0.330)#1,317 |
| 30. | Yale | 60.6% | 29.9%(+0.307)#30 | 28.0%(+0.326)#1,356 |
| 31. | Beacon | 60.2% | 29.9%(+0.303)#31 | 28.0%(+0.322)#1,404 |
| 32. | Mitchellville | 60.0% | 29.9%(+0.300)#32 | 28.0%(+0.320)#1,432 |
| 33. | Benton | 59.6% | 29.9%(+0.297)#33 | 28.0%(+0.316)#1,488 |
| 34. | Waucoma | 59.4% | 29.9%(+0.295)#34 | 28.0%(+0.314)#1,527 |
| 35. | Chelsea | 59.1% | 29.9%(+0.292)#35 | 28.0%(+0.311)#1,582 |
| 36. | Sandusky | 59.0% | 29.9%(+0.291)#36 | 28.0%(+0.310)#1,590 |
| 37. | Joice | 58.2% | 29.9%(+0.283)#37 | 28.0%(+0.302)#1,700 |
| 38. | Hull | 58.2% | 29.9%(+0.283)#38 | 28.0%(+0.302)#1,706 |
| 39. | Story City | 57.9% | 29.9%(+0.280)#39 | 28.0%(+0.299)#1,749 |
| 40. | Montezuma | 57.7% | 29.9%(+0.278)#40 | 28.0%(+0.297)#1,795 |
| 41. | Lucas | 57.6% | 29.9%(+0.277)#41 | 28.0%(+0.296)#1,806 |
| 42. | New Sharon | 57.5% | 29.9%(+0.276)#42 | 28.0%(+0.295)#1,826 |
| 43. | Clare | 57.4% | 29.9%(+0.274)#43 | 28.0%(+0.294)#1,847 |
| 44. | Charter Oak | 57.3% | 29.9%(+0.273)#44 | 28.0%(+0.293)#1,865 |
| 45. | Maurice | 57.2% | 29.9%(+0.272)#45 | 28.0%(+0.292)#1,879 |
| 46. | Farnhamville | 57.1% | 29.9%(+0.272)#46 | 28.0%(+0.291)#1,894 |
| 47. | Sanborn | 57.0% | 29.9%(+0.271)#47 | 28.0%(+0.290)#1,902 |
| 48. | Little Rock | 56.6% | 29.9%(+0.267)#48 | 28.0%(+0.287)#1,974 |
| 49. | Whitten | 56.6% | 29.9%(+0.267)#49 | 28.0%(+0.286)#1,980 |
| 50. | Pomeroy | 56.5% | 29.9%(+0.265)#50 | 28.0%(+0.285)#2,008 |
| 51. | Schaller | 56.3% | 29.9%(+0.264)#51 | 28.0%(+0.284)#2,031 |
| 52. | Blairsburg | 56.0% | 29.9%(+0.261)#52 | 28.0%(+0.280)#2,099 |
| 53. | Lehigh | 55.6% | 29.9%(+0.257)#53 | 28.0%(+0.276)#2,179 |
| 54. | Welton | 55.6% | 29.9%(+0.256)#54 | 28.0%(+0.276)#2,192 |
| 55. | Grinnell | 55.5% | 29.9%(+0.256)#55 | 28.0%(+0.275)#2,207 |
| 56. | Albert City | 55.4% | 29.9%(+0.255)#56 | 28.0%(+0.275)#2,216 |
| 57. | Davis City | 55.4% | 29.9%(+0.255)#57 | 28.0%(+0.274)#2,227 |
| 58. | Rowan | 54.9% | 29.9%(+0.250)#58 | 28.0%(+0.270)#2,301 |
| 59. | Okoboji | 54.7% | 29.9%(+0.248)#59 | 28.0%(+0.267)#2,354 |
| 60. | Kamrar | 54.2% | 29.9%(+0.243)#60 | 28.0%(+0.262)#2,476 |
| 61. | Alleman | 54.0% | 29.9%(+0.241)#61 | 28.0%(+0.260)#2,525 |
| 62. | Churdan | 53.8% | 29.9%(+0.239)#62 | 28.0%(+0.259)#2,556 |
| 63. | Windsor Heights | 53.8% | 29.9%(+0.239)#63 | 28.0%(+0.258)#2,567 |
| 64. | Irwin | 53.8% | 29.9%(+0.239)#64 | 28.0%(+0.258)#2,569 |
| 65. | Cedar Falls | 53.7% | 29.9%(+0.238)#65 | 28.0%(+0.257)#2,584 |
| 66. | Bussey | 53.2% | 29.9%(+0.233)#66 | 28.0%(+0.252)#2,682 |
| 67. | Stratford | 53.1% | 29.9%(+0.232)#67 | 28.0%(+0.251)#2,695 |
| 68. | Soldier | 53.1% | 29.9%(+0.232)#68 | 28.0%(+0.251)#2,696 |
| 69. | Mediapolis | 53.0% | 29.9%(+0.230)#69 | 28.0%(+0.250)#2,738 |
| 70. | Smithland | 52.7% | 29.9%(+0.228)#70 | 28.0%(+0.247)#2,801 |
| 71. | Macedonia | 52.4% | 29.9%(+0.225)#71 | 28.0%(+0.244)#2,868 |
| 72. | Buffalo | 52.4% | 29.9%(+0.225)#72 | 28.0%(+0.244)#2,883 |
| 73. | Sutherland | 52.4% | 29.9%(+0.225)#73 | 28.0%(+0.244)#2,885 |
| 74. | Woolstock | 52.3% | 29.9%(+0.224)#74 | 28.0%(+0.243)#2,896 |
| 75. | Marcus | 52.2% | 29.9%(+0.223)#75 | 28.0%(+0.242)#2,933 |
| 76. | Sioux Rapids | 52.2% | 29.9%(+0.223)#76 | 28.0%(+0.242)#2,936 |
| 77. | Moravia | 52.2% | 29.9%(+0.223)#77 | 28.0%(+0.242)#2,941 |
| 78. | Laurel | 52.2% | 29.9%(+0.222)#78 | 28.0%(+0.242)#2,944 |
| 79. | Hillsboro | 52.1% | 29.9%(+0.222)#79 | 28.0%(+0.241)#2,951 |
| 80. | Plainfield | 51.7% | 29.9%(+0.218)#80 | 28.0%(+0.237)#3,062 |
| 81. | Mooar | 51.5% | 29.9%(+0.215)#81 | 28.0%(+0.235)#3,107 |
| 82. | Creston | 51.4% | 29.9%(+0.215)#82 | 28.0%(+0.234)#3,118 |
| 83. | Spillville | 51.4% | 29.9%(+0.215)#83 | 28.0%(+0.234)#3,129 |
| 84. | Solon | 51.4% | 29.9%(+0.214)#84 | 28.0%(+0.234)#3,135 |
| 85. | Anthon | 51.2% | 29.9%(+0.213)#85 | 28.0%(+0.232)#3,181 |
| 86. | Lakeside | 51.1% | 29.9%(+0.212)#86 | 28.0%(+0.231)#3,202 |
| 87. | Danville | 51.1% | 29.9%(+0.212)#87 | 28.0%(+0.231)#3,212 |
| 88. | Wiota | 50.9% | 29.9%(+0.210)#88 | 28.0%(+0.229)#3,250 |
| 89. | Rock Falls | 50.8% | 29.9%(+0.209)#89 | 28.0%(+0.228)#3,272 |
| 90. | Toronto | 50.8% | 29.9%(+0.209)#90 | 28.0%(+0.228)#3,280 |
| 91. | Waukon | 50.6% | 29.9%(+0.207)#91 | 28.0%(+0.226)#3,313 |
| 92. | Brighton | 50.5% | 29.9%(+0.206)#92 | 28.0%(+0.226)#3,335 |
| 93. | Oxford Junction | 50.5% | 29.9%(+0.206)#93 | 28.0%(+0.225)#3,346 |
| 94. | Halbur | 50.4% | 29.9%(+0.205)#94 | 28.0%(+0.224)#3,379 |
| 95. | Tingley | 50.3% | 29.9%(+0.204)#95 | 28.0%(+0.223)#3,400 |
| 96. | Kent Estates | 50.3% | 29.9%(+0.204)#96 | 28.0%(+0.223)#3,410 |
| 97. | Modale | 50.1% | 29.9%(+0.202)#97 | 28.0%(+0.221)#3,467 |
| 98. | Rockwell City | 50.1% | 29.9%(+0.201)#98 | 28.0%(+0.221)#3,476 |
| 99. | Le Claire | 50.0% | 29.9%(+0.201)#99 | 28.0%(+0.221)#3,479 |
| 100. | Derby | 50.0% | 29.9%(+0.201)#100 | 28.0%(+0.220)#3,499 |
Common Questions
What are the Top 10 Cities with the Highest Wage/Income Gap (%) in Iowa?
Top 10 Cities with the Highest Wage/Income Gap (%) in Iowa are:
#1
91.1%
#2
86.7%
#3
77.7%
#4
73.9%
#5
73.0%
#6
72.7%
#7
71.5%
#8
71.1%
#9
70.5%
#10
68.4%
What city has the Highest Wage/Income Gap (%) in Iowa?
Bradgate has the Highest Wage/Income Gap (%) in Iowa with 91.1%.
What is the Wage / Income Gap in Percentage Terms in the State of Iowa?
Wage / Income Gap in Percentage Terms in Iowa is 29.9%.
What is the Wage / Income Gap in Percentage Terms in the United States?
Wage / Income Gap in Percentage Terms in the United States is 28.0%.