Cities with the Highest Wage/Income Gap (%) in Maryland
RELATED REPORTS & OPTIONS
Highest Wage/Income Gap (%)
Maryland
Compare Cities
Map of Cities with the Highest Wage/Income Gap (%) in Maryland
0.0%
100.0%
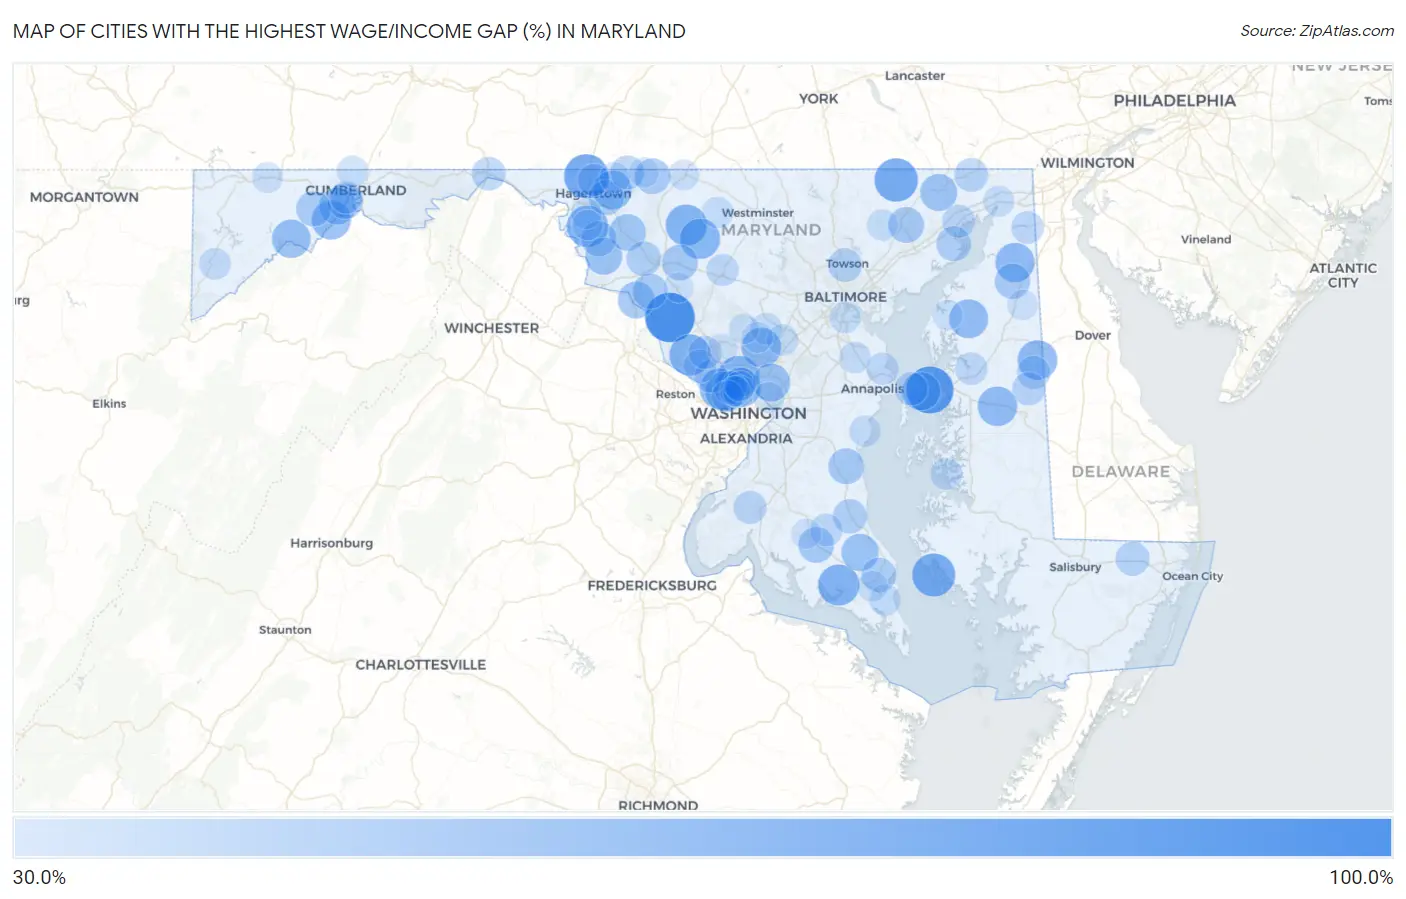
Cities with the Highest Wage/Income Gap (%) in Maryland
| City | Wage/Income Gap (%) | vs State | vs National | |
| 1. | Barnesville | 83.7% | 21.9%(+0.618)#1 | 28.0%(+0.557)#137 |
| 2. | Ten Mile Creek | 80.7% | 21.9%(+0.588)#2 | 28.0%(+0.527)#181 |
| 3. | Kent Narrows | 77.9% | 21.9%(+0.560)#3 | 28.0%(+0.499)#220 |
| 4. | Maugansville | 70.7% | 21.9%(+0.488)#4 | 28.0%(+0.427)#464 |
| 5. | Pylesville | 68.7% | 21.9%(+0.468)#5 | 28.0%(+0.407)#596 |
| 6. | Fishing Creek | 67.8% | 21.9%(+0.459)#6 | 28.0%(+0.399)#659 |
| 7. | Tilghmanton | 63.9% | 21.9%(+0.420)#7 | 28.0%(+0.360)#981 |
| 8. | Darnestown | 63.5% | 21.9%(+0.416)#8 | 28.0%(+0.355)#1,039 |
| 9. | Chevy Chase View | 63.4% | 21.9%(+0.415)#9 | 28.0%(+0.354)#1,040 |
| 10. | Leonardtown | 63.4% | 21.9%(+0.415)#10 | 28.0%(+0.354)#1,044 |
| 11. | Woodsboro | 63.2% | 21.9%(+0.413)#11 | 28.0%(+0.352)#1,077 |
| 12. | Cabin John | 61.8% | 21.9%(+0.399)#12 | 28.0%(+0.339)#1,214 |
| 13. | Libertytown | 61.5% | 21.9%(+0.396)#13 | 28.0%(+0.335)#1,278 |
| 14. | Glen Echo | 60.4% | 21.9%(+0.385)#14 | 28.0%(+0.324)#1,384 |
| 15. | Henderson | 59.7% | 21.9%(+0.378)#15 | 28.0%(+0.317)#1,459 |
| 16. | Spencerville | 59.6% | 21.9%(+0.377)#16 | 28.0%(+0.317)#1,478 |
| 17. | Hillsboro | 59.5% | 21.9%(+0.376)#17 | 28.0%(+0.316)#1,497 |
| 18. | Cecilton | 58.8% | 21.9%(+0.369)#18 | 28.0%(+0.308)#1,627 |
| 19. | Bier | 58.6% | 21.9%(+0.367)#19 | 28.0%(+0.306)#1,653 |
| 20. | Martin S Additions | 58.2% | 21.9%(+0.363)#20 | 28.0%(+0.302)#1,699 |
| 21. | Chewsville | 58.0% | 21.9%(+0.361)#21 | 28.0%(+0.300)#1,741 |
| 22. | Chestertown | 57.9% | 21.9%(+0.360)#22 | 28.0%(+0.299)#1,758 |
| 23. | Westernport | 57.2% | 21.9%(+0.353)#23 | 28.0%(+0.292)#1,877 |
| 24. | Chester | 56.7% | 21.9%(+0.348)#24 | 28.0%(+0.287)#1,962 |
| 25. | College Park | 55.2% | 21.9%(+0.333)#25 | 28.0%(+0.272)#2,260 |
| 26. | Broomes Island | 54.3% | 21.9%(+0.324)#26 | 28.0%(+0.264)#2,440 |
| 27. | Darlington | 53.6% | 21.9%(+0.317)#27 | 28.0%(+0.256)#2,605 |
| 28. | Trego Rohrersville Station | 53.4% | 21.9%(+0.315)#28 | 28.0%(+0.254)#2,637 |
| 29. | Point Of Rocks | 53.1% | 21.9%(+0.312)#29 | 28.0%(+0.251)#2,698 |
| 30. | Cresaptown | 53.1% | 21.9%(+0.312)#30 | 28.0%(+0.251)#2,700 |
| 31. | Myersville | 52.6% | 21.9%(+0.307)#31 | 28.0%(+0.246)#2,817 |
| 32. | Wildewood | 51.8% | 21.9%(+0.299)#32 | 28.0%(+0.238)#3,024 |
| 33. | Bel Air | 50.8% | 21.9%(+0.289)#33 | 28.0%(+0.228)#3,268 |
| 34. | Owings | 50.6% | 21.9%(+0.287)#34 | 28.0%(+0.226)#3,316 |
| 35. | Mechanicsville | 50.5% | 21.9%(+0.286)#35 | 28.0%(+0.225)#3,364 |
| 36. | Spring Ridge | 50.4% | 21.9%(+0.285)#36 | 28.0%(+0.225)#3,368 |
| 37. | Sabillasville | 50.3% | 21.9%(+0.284)#37 | 28.0%(+0.223)#3,409 |
| 38. | Potomac Park | 50.1% | 21.9%(+0.282)#38 | 28.0%(+0.221)#3,469 |
| 39. | Galena | 49.9% | 21.9%(+0.280)#39 | 28.0%(+0.219)#3,520 |
| 40. | Keedysville | 49.4% | 21.9%(+0.275)#40 | 28.0%(+0.214)#3,651 |
| 41. | Robinwood | 49.3% | 21.9%(+0.274)#41 | 28.0%(+0.213)#3,692 |
| 42. | Midland | 49.3% | 21.9%(+0.274)#42 | 28.0%(+0.213)#3,694 |
| 43. | Adamstown | 49.0% | 21.9%(+0.271)#43 | 28.0%(+0.211)#3,769 |
| 44. | Aberdeen Proving Ground | 48.4% | 21.9%(+0.265)#44 | 28.0%(+0.205)#3,953 |
| 45. | Solomons | 48.2% | 21.9%(+0.263)#45 | 28.0%(+0.202)#4,037 |
| 46. | Braddock Heights | 47.9% | 21.9%(+0.260)#46 | 28.0%(+0.199)#4,127 |
| 47. | Prince Frederick | 47.2% | 21.9%(+0.253)#47 | 28.0%(+0.192)#4,370 |
| 48. | Willards | 46.4% | 21.9%(+0.245)#48 | 28.0%(+0.184)#4,608 |
| 49. | Ringgold | 46.2% | 21.9%(+0.243)#49 | 28.0%(+0.182)#4,692 |
| 50. | Towson | 45.8% | 21.9%(+0.239)#50 | 28.0%(+0.179)#4,815 |
| 51. | Rising Sun | 45.6% | 21.9%(+0.237)#51 | 28.0%(+0.176)#4,916 |
| 52. | Hancock | 45.5% | 21.9%(+0.236)#52 | 28.0%(+0.175)#4,957 |
| 53. | Chevy Chase | 45.2% | 21.9%(+0.233)#53 | 28.0%(+0.172)#5,057 |
| 54. | Goldsboro | 44.8% | 21.9%(+0.229)#54 | 28.0%(+0.168)#5,201 |
| 55. | Greensboro | 44.8% | 21.9%(+0.229)#55 | 28.0%(+0.168)#5,221 |
| 56. | Bethesda | 44.7% | 21.9%(+0.228)#56 | 28.0%(+0.167)#5,277 |
| 57. | Stevensville | 44.7% | 21.9%(+0.228)#57 | 28.0%(+0.167)#5,283 |
| 58. | Potomac | 44.6% | 21.9%(+0.227)#58 | 28.0%(+0.166)#5,306 |
| 59. | Pomfret | 44.3% | 21.9%(+0.224)#59 | 28.0%(+0.164)#5,384 |
| 60. | Travilah | 44.2% | 21.9%(+0.223)#60 | 28.0%(+0.162)#5,446 |
| 61. | Havre De Grace | 44.2% | 21.9%(+0.223)#61 | 28.0%(+0.162)#5,450 |
| 62. | North Potomac | 44.1% | 21.9%(+0.222)#62 | 28.0%(+0.161)#5,480 |
| 63. | Golden Beach | 43.4% | 21.9%(+0.215)#63 | 28.0%(+0.154)#5,767 |
| 64. | Centreville | 43.1% | 21.9%(+0.212)#64 | 28.0%(+0.152)#5,891 |
| 65. | Chesapeake City | 43.1% | 21.9%(+0.212)#65 | 28.0%(+0.151)#5,901 |
| 66. | Bowling Green | 42.5% | 21.9%(+0.206)#66 | 28.0%(+0.145)#6,188 |
| 67. | Mount Airy | 42.2% | 21.9%(+0.203)#67 | 28.0%(+0.142)#6,296 |
| 68. | Fountainhead Orchard Hills | 42.1% | 21.9%(+0.202)#68 | 28.0%(+0.141)#6,339 |
| 69. | Cape St Claire | 41.9% | 21.9%(+0.200)#69 | 28.0%(+0.139)#6,404 |
| 70. | Chevy Chase Village | 41.8% | 21.9%(+0.199)#70 | 28.0%(+0.138)#6,446 |
| 71. | Oxford | 41.5% | 21.9%(+0.196)#71 | 28.0%(+0.135)#6,592 |
| 72. | Brookmont | 41.2% | 21.9%(+0.193)#72 | 28.0%(+0.132)#6,711 |
| 73. | Mountain Lake Park | 41.2% | 21.9%(+0.193)#73 | 28.0%(+0.132)#6,722 |
| 74. | Highland | 41.1% | 21.9%(+0.192)#74 | 28.0%(+0.131)#6,789 |
| 75. | Shady Side | 40.9% | 21.9%(+0.190)#75 | 28.0%(+0.129)#6,843 |
| 76. | Union Bridge | 40.8% | 21.9%(+0.189)#76 | 28.0%(+0.128)#6,879 |
| 77. | Lexington Park | 40.5% | 21.9%(+0.186)#77 | 28.0%(+0.125)#7,008 |
| 78. | Scaggsville | 40.5% | 21.9%(+0.186)#78 | 28.0%(+0.125)#7,019 |
| 79. | Severna Park | 40.5% | 21.9%(+0.186)#79 | 28.0%(+0.125)#7,022 |
| 80. | Brooklyn Park | 40.5% | 21.9%(+0.186)#80 | 28.0%(+0.125)#7,028 |
| 81. | Ellerslie | 40.1% | 21.9%(+0.182)#81 | 28.0%(+0.122)#7,169 |
| 82. | Fallston | 39.9% | 21.9%(+0.180)#82 | 28.0%(+0.119)#7,269 |
| 83. | North East | 39.8% | 21.9%(+0.179)#83 | 28.0%(+0.119)#7,304 |
| 84. | North Brentwood | 39.6% | 21.9%(+0.177)#84 | 28.0%(+0.116)#7,398 |
| 85. | California | 39.3% | 21.9%(+0.174)#85 | 28.0%(+0.113)#7,581 |
| 86. | Grantsville | 39.1% | 21.9%(+0.172)#86 | 28.0%(+0.111)#7,641 |
| 87. | Emmitsburg | 39.0% | 21.9%(+0.171)#87 | 28.0%(+0.110)#7,702 |
| 88. | Leitersburg | 39.0% | 21.9%(+0.171)#88 | 28.0%(+0.110)#7,705 |
| 89. | St James | 39.0% | 21.9%(+0.171)#89 | 28.0%(+0.110)#7,726 |
| 90. | Ashton Sandy Spring | 38.9% | 21.9%(+0.170)#90 | 28.0%(+0.109)#7,747 |
| 91. | Chevy Chase Section Five | 38.5% | 21.9%(+0.166)#91 | 28.0%(+0.105)#7,923 |
| 92. | Fairplay | 38.2% | 21.9%(+0.163)#92 | 28.0%(+0.103)#8,039 |
| 93. | Millington | 38.2% | 21.9%(+0.163)#93 | 28.0%(+0.102)#8,077 |
| 94. | Fairlee | 38.2% | 21.9%(+0.163)#94 | 28.0%(+0.102)#8,084 |
| 95. | Brookeville | 38.1% | 21.9%(+0.162)#95 | 28.0%(+0.101)#8,106 |
| 96. | Derwood | 38.1% | 21.9%(+0.162)#96 | 28.0%(+0.101)#8,114 |
| 97. | Charlotte Hall | 38.0% | 21.9%(+0.161)#97 | 28.0%(+0.100)#8,162 |
| 98. | Highfield Cascade | 38.0% | 21.9%(+0.161)#98 | 28.0%(+0.100)#8,168 |
| 99. | Somerset | 37.9% | 21.9%(+0.160)#99 | 28.0%(+0.099)#8,202 |
| 100. | Urbana | 37.7% | 21.9%(+0.158)#100 | 28.0%(+0.097)#8,293 |
Common Questions
What are the Top 10 Cities with the Highest Wage/Income Gap (%) in Maryland?
Top 10 Cities with the Highest Wage/Income Gap (%) in Maryland are:
#1
83.7%
#2
77.9%
#3
70.7%
#4
68.7%
#5
67.8%
#6
63.9%
#7
63.5%
#8
63.4%
#9
63.4%
#10
63.2%
What city has the Highest Wage/Income Gap (%) in Maryland?
Barnesville has the Highest Wage/Income Gap (%) in Maryland with 83.7%.
What is the Wage / Income Gap in Percentage Terms in the State of Maryland?
Wage / Income Gap in Percentage Terms in Maryland is 21.9%.
What is the Wage / Income Gap in Percentage Terms in the United States?
Wage / Income Gap in Percentage Terms in the United States is 28.0%.