Cities with the Highest Wage/Income Gap (%) in Illinois
RELATED REPORTS & OPTIONS
Highest Wage/Income Gap (%)
Illinois
Compare Cities
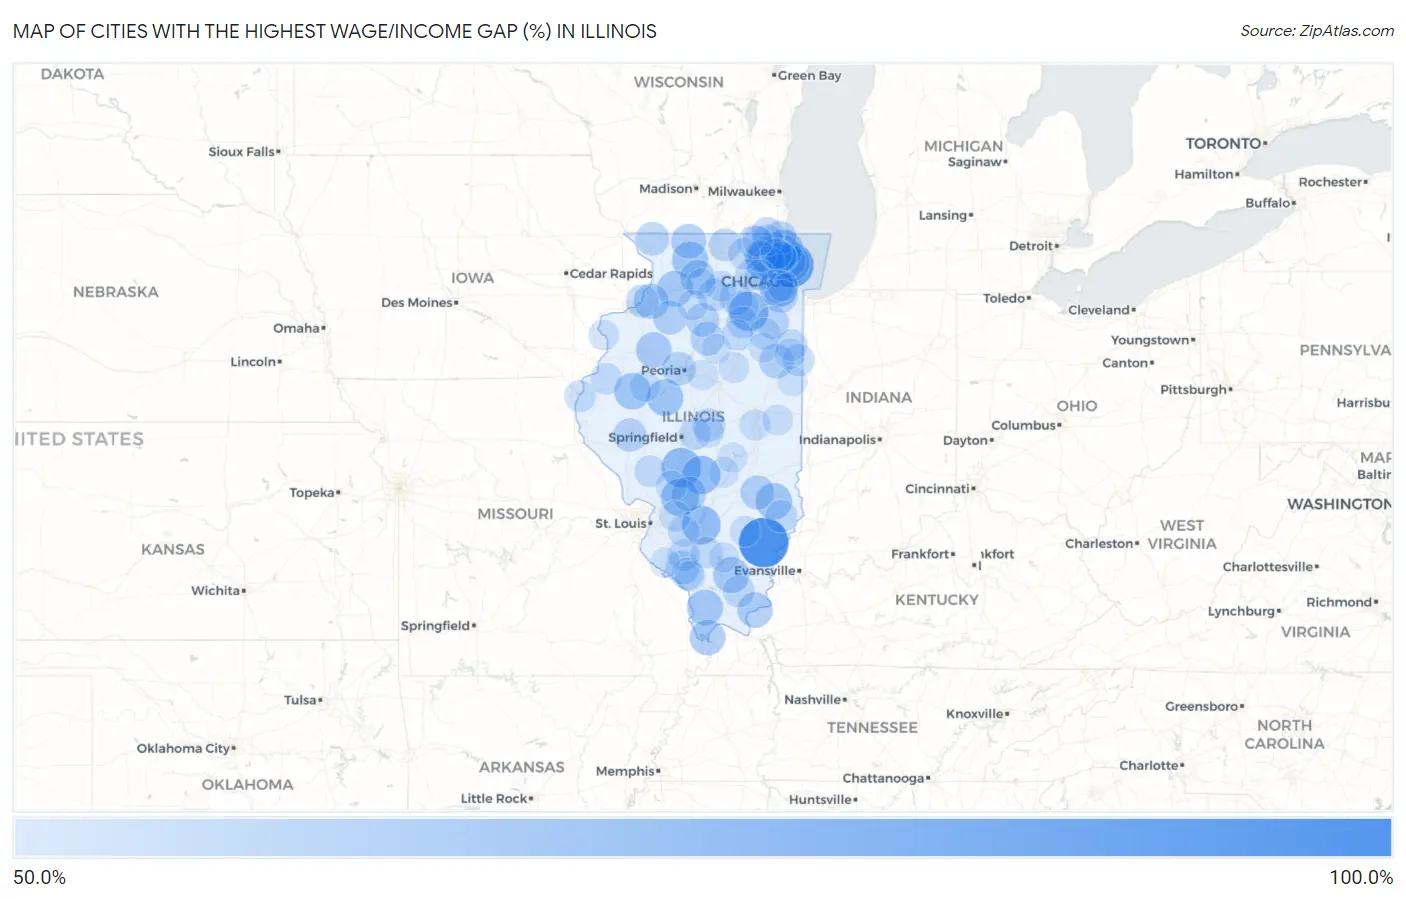
Map of Cities with the Highest Wage/Income Gap (%) in Illinois
0.0%
100.0%
Cities with the Highest Wage/Income Gap (%) in Illinois
| City | Wage/Income Gap (%) | vs State | vs National | |
| 1. | Golden Gate | 94.8% | 29.6%(+0.652)#1 | 28.0%(+0.668)#30 |
| 2. | Kenilworth | 85.2% | 29.6%(+0.556)#2 | 28.0%(+0.572)#122 |
| 3. | Waggoner | 74.3% | 29.6%(+0.447)#3 | 28.0%(+0.463)#306 |
| 4. | Lisbon | 74.1% | 29.6%(+0.445)#4 | 28.0%(+0.461)#315 |
| 5. | Winnetka | 73.4% | 29.6%(+0.438)#5 | 28.0%(+0.454)#346 |
| 6. | Hinsdale | 73.0% | 29.6%(+0.435)#6 | 28.0%(+0.451)#363 |
| 7. | Huey | 72.9% | 29.6%(+0.433)#7 | 28.0%(+0.449)#373 |
| 8. | Coalton | 72.2% | 29.6%(+0.426)#8 | 28.0%(+0.442)#411 |
| 9. | Lake Bluff | 72.0% | 29.6%(+0.424)#9 | 28.0%(+0.440)#422 |
| 10. | New Douglas | 70.6% | 29.6%(+0.411)#10 | 28.0%(+0.427)#466 |
| 11. | Barrington Hills | 69.7% | 29.6%(+0.401)#11 | 28.0%(+0.417)#528 |
| 12. | Topeka | 68.7% | 29.6%(+0.391)#12 | 28.0%(+0.407)#597 |
| 13. | Ste Marie | 68.6% | 29.6%(+0.390)#13 | 28.0%(+0.406)#605 |
| 14. | Adair | 68.4% | 29.6%(+0.389)#14 | 28.0%(+0.404)#614 |
| 15. | Adeline | 68.0% | 29.6%(+0.384)#15 | 28.0%(+0.400)#648 |
| 16. | Thompsonville | 67.6% | 29.6%(+0.380)#16 | 28.0%(+0.396)#680 |
| 17. | Anna | 67.4% | 29.6%(+0.378)#17 | 28.0%(+0.394)#696 |
| 18. | Lake Barrington | 67.0% | 29.6%(+0.375)#18 | 28.0%(+0.390)#715 |
| 19. | Como | 67.0% | 29.6%(+0.374)#19 | 28.0%(+0.390)#724 |
| 20. | Cairo | 66.7% | 29.6%(+0.371)#20 | 28.0%(+0.387)#749 |
| 21. | Oak Run | 66.4% | 29.6%(+0.369)#21 | 28.0%(+0.385)#769 |
| 22. | Rosiclare | 66.1% | 29.6%(+0.366)#22 | 28.0%(+0.382)#793 |
| 23. | Holcomb | 65.8% | 29.6%(+0.362)#23 | 28.0%(+0.378)#820 |
| 24. | Hillsdale | 65.7% | 29.6%(+0.361)#24 | 28.0%(+0.377)#829 |
| 25. | Lake Forest | 65.3% | 29.6%(+0.357)#25 | 28.0%(+0.373)#862 |
| 26. | Dakota | 65.2% | 29.6%(+0.356)#26 | 28.0%(+0.372)#869 |
| 27. | Lost Nation | 65.0% | 29.6%(+0.354)#27 | 28.0%(+0.370)#892 |
| 28. | Panama | 64.6% | 29.6%(+0.350)#28 | 28.0%(+0.366)#927 |
| 29. | Danforth | 63.9% | 29.6%(+0.344)#29 | 28.0%(+0.359)#983 |
| 30. | Mineral | 63.6% | 29.6%(+0.340)#30 | 28.0%(+0.356)#1,024 |
| 31. | Wheeler | 63.5% | 29.6%(+0.339)#31 | 28.0%(+0.355)#1,035 |
| 32. | Glencoe | 63.2% | 29.6%(+0.337)#32 | 28.0%(+0.353)#1,070 |
| 33. | Norwood | 63.1% | 29.6%(+0.335)#33 | 28.0%(+0.351)#1,084 |
| 34. | Wonder Lake | 62.9% | 29.6%(+0.333)#34 | 28.0%(+0.349)#1,094 |
| 35. | Magnolia | 62.9% | 29.6%(+0.333)#35 | 28.0%(+0.349)#1,102 |
| 36. | Percy | 62.7% | 29.6%(+0.331)#36 | 28.0%(+0.347)#1,128 |
| 37. | Seatonville | 62.6% | 29.6%(+0.331)#37 | 28.0%(+0.347)#1,134 |
| 38. | Apple Canyon Lake | 62.6% | 29.6%(+0.331)#38 | 28.0%(+0.346)#1,135 |
| 39. | Meredosia | 62.6% | 29.6%(+0.330)#39 | 28.0%(+0.346)#1,138 |
| 40. | Clarendon Hills | 61.8% | 29.6%(+0.322)#40 | 28.0%(+0.338)#1,223 |
| 41. | Palos Park | 61.7% | 29.6%(+0.322)#41 | 28.0%(+0.337)#1,235 |
| 42. | Latham | 61.7% | 29.6%(+0.321)#42 | 28.0%(+0.337)#1,238 |
| 43. | Symerton | 61.7% | 29.6%(+0.321)#43 | 28.0%(+0.337)#1,249 |
| 44. | Wadsworth | 61.7% | 29.6%(+0.321)#44 | 28.0%(+0.337)#1,250 |
| 45. | Somonauk | 61.5% | 29.6%(+0.319)#45 | 28.0%(+0.335)#1,268 |
| 46. | Lake Catherine | 61.4% | 29.6%(+0.318)#46 | 28.0%(+0.334)#1,283 |
| 47. | Port Byron | 61.4% | 29.6%(+0.318)#47 | 28.0%(+0.334)#1,286 |
| 48. | Timberlane | 60.9% | 29.6%(+0.313)#48 | 28.0%(+0.329)#1,325 |
| 49. | Compton | 60.6% | 29.6%(+0.310)#49 | 28.0%(+0.326)#1,370 |
| 50. | Lincolnshire | 60.4% | 29.6%(+0.308)#50 | 28.0%(+0.324)#1,387 |
| 51. | Sumner | 60.1% | 29.6%(+0.306)#51 | 28.0%(+0.322)#1,410 |
| 52. | Inverness | 59.9% | 29.6%(+0.304)#52 | 28.0%(+0.320)#1,434 |
| 53. | Iroquois | 59.9% | 29.6%(+0.303)#53 | 28.0%(+0.319)#1,446 |
| 54. | Campton Hills | 59.8% | 29.6%(+0.302)#54 | 28.0%(+0.318)#1,457 |
| 55. | Carrier Mills | 59.7% | 29.6%(+0.301)#55 | 28.0%(+0.317)#1,472 |
| 56. | Coulterville | 59.6% | 29.6%(+0.300)#56 | 28.0%(+0.316)#1,482 |
| 57. | Buffalo | 59.5% | 29.6%(+0.300)#57 | 28.0%(+0.316)#1,499 |
| 58. | Newark | 59.5% | 29.6%(+0.299)#58 | 28.0%(+0.315)#1,509 |
| 59. | Ridgefield | 59.4% | 29.6%(+0.299)#59 | 28.0%(+0.315)#1,512 |
| 60. | Campbell Hill | 59.3% | 29.6%(+0.298)#60 | 28.0%(+0.313)#1,533 |
| 61. | Seneca | 59.2% | 29.6%(+0.296)#61 | 28.0%(+0.312)#1,553 |
| 62. | St Anne | 59.1% | 29.6%(+0.296)#62 | 28.0%(+0.312)#1,568 |
| 63. | Du Bois | 59.1% | 29.6%(+0.295)#63 | 28.0%(+0.311)#1,570 |
| 64. | Fox Lake Hills | 59.1% | 29.6%(+0.295)#64 | 28.0%(+0.311)#1,573 |
| 65. | Union | 59.1% | 29.6%(+0.295)#65 | 28.0%(+0.311)#1,576 |
| 66. | Bonnie Brae | 59.0% | 29.6%(+0.294)#66 | 28.0%(+0.310)#1,589 |
| 67. | Damiansville | 59.0% | 29.6%(+0.294)#67 | 28.0%(+0.310)#1,593 |
| 68. | Warsaw | 59.0% | 29.6%(+0.294)#68 | 28.0%(+0.310)#1,598 |
| 69. | Greenfield | 58.9% | 29.6%(+0.294)#69 | 28.0%(+0.309)#1,601 |
| 70. | La Harpe | 58.9% | 29.6%(+0.293)#70 | 28.0%(+0.309)#1,606 |
| 71. | Trout Valley | 58.8% | 29.6%(+0.292)#71 | 28.0%(+0.308)#1,620 |
| 72. | Essex | 58.8% | 29.6%(+0.292)#72 | 28.0%(+0.308)#1,624 |
| 73. | Riverwoods | 58.5% | 29.6%(+0.289)#73 | 28.0%(+0.305)#1,673 |
| 74. | Ransom | 58.4% | 29.6%(+0.288)#74 | 28.0%(+0.304)#1,680 |
| 75. | Gillespie | 58.1% | 29.6%(+0.285)#75 | 28.0%(+0.301)#1,717 |
| 76. | St Jacob | 58.0% | 29.6%(+0.285)#76 | 28.0%(+0.301)#1,728 |
| 77. | Smithfield | 58.0% | 29.6%(+0.284)#77 | 28.0%(+0.300)#1,743 |
| 78. | Wayne | 57.9% | 29.6%(+0.283)#78 | 28.0%(+0.299)#1,752 |
| 79. | Indian Creek | 57.9% | 29.6%(+0.283)#79 | 28.0%(+0.299)#1,760 |
| 80. | Lee | 57.8% | 29.6%(+0.282)#80 | 28.0%(+0.298)#1,773 |
| 81. | Sadorus | 57.8% | 29.6%(+0.282)#81 | 28.0%(+0.298)#1,778 |
| 82. | Martinton | 57.6% | 29.6%(+0.280)#82 | 28.0%(+0.296)#1,810 |
| 83. | Homer | 57.4% | 29.6%(+0.279)#83 | 28.0%(+0.294)#1,837 |
| 84. | Chenoa | 57.1% | 29.6%(+0.276)#84 | 28.0%(+0.291)#1,883 |
| 85. | New Boston | 57.1% | 29.6%(+0.275)#85 | 28.0%(+0.291)#1,890 |
| 86. | Johnsonville | 57.0% | 29.6%(+0.274)#86 | 28.0%(+0.290)#1,901 |
| 87. | Lakewood | 56.8% | 29.6%(+0.272)#87 | 28.0%(+0.288)#1,946 |
| 88. | Goodfield | 56.7% | 29.6%(+0.271)#88 | 28.0%(+0.287)#1,968 |
| 89. | Ava | 56.7% | 29.6%(+0.271)#89 | 28.0%(+0.287)#1,971 |
| 90. | La Grange | 56.6% | 29.6%(+0.270)#90 | 28.0%(+0.286)#1,985 |
| 91. | Franklin Grove | 56.6% | 29.6%(+0.270)#91 | 28.0%(+0.286)#1,990 |
| 92. | Ringwood | 56.6% | 29.6%(+0.270)#92 | 28.0%(+0.286)#1,991 |
| 93. | Ina | 56.5% | 29.6%(+0.269)#93 | 28.0%(+0.285)#1,998 |
| 94. | Wellington | 56.4% | 29.6%(+0.269)#94 | 28.0%(+0.285)#2,012 |
| 95. | Ohio | 56.3% | 29.6%(+0.268)#95 | 28.0%(+0.284)#2,029 |
| 96. | Findlay | 56.3% | 29.6%(+0.267)#96 | 28.0%(+0.283)#2,045 |
| 97. | Niantic | 56.2% | 29.6%(+0.266)#97 | 28.0%(+0.282)#2,054 |
| 98. | Evansville | 56.1% | 29.6%(+0.265)#98 | 28.0%(+0.281)#2,082 |
| 99. | Cabery | 56.0% | 29.6%(+0.264)#99 | 28.0%(+0.280)#2,102 |
| 100. | Rutland | 56.0% | 29.6%(+0.264)#100 | 28.0%(+0.280)#2,110 |
Common Questions
What are the Top 10 Cities with the Highest Wage/Income Gap (%) in Illinois?
Top 10 Cities with the Highest Wage/Income Gap (%) in Illinois are:
#1
94.8%
#2
85.2%
#3
74.3%
#4
74.1%
#5
73.4%
#6
73.0%
#7
72.9%
#8
72.2%
#9
72.0%
#10
70.6%
What city has the Highest Wage/Income Gap (%) in Illinois?
Golden Gate has the Highest Wage/Income Gap (%) in Illinois with 94.8%.
What is the Wage / Income Gap in Percentage Terms in the State of Illinois?
Wage / Income Gap in Percentage Terms in Illinois is 29.6%.
What is the Wage / Income Gap in Percentage Terms in the United States?
Wage / Income Gap in Percentage Terms in the United States is 28.0%.