Cities with the Highest Percentage of Canadian Population in New York
RELATED REPORTS & OPTIONS
Canadian
New York
Compare Cities
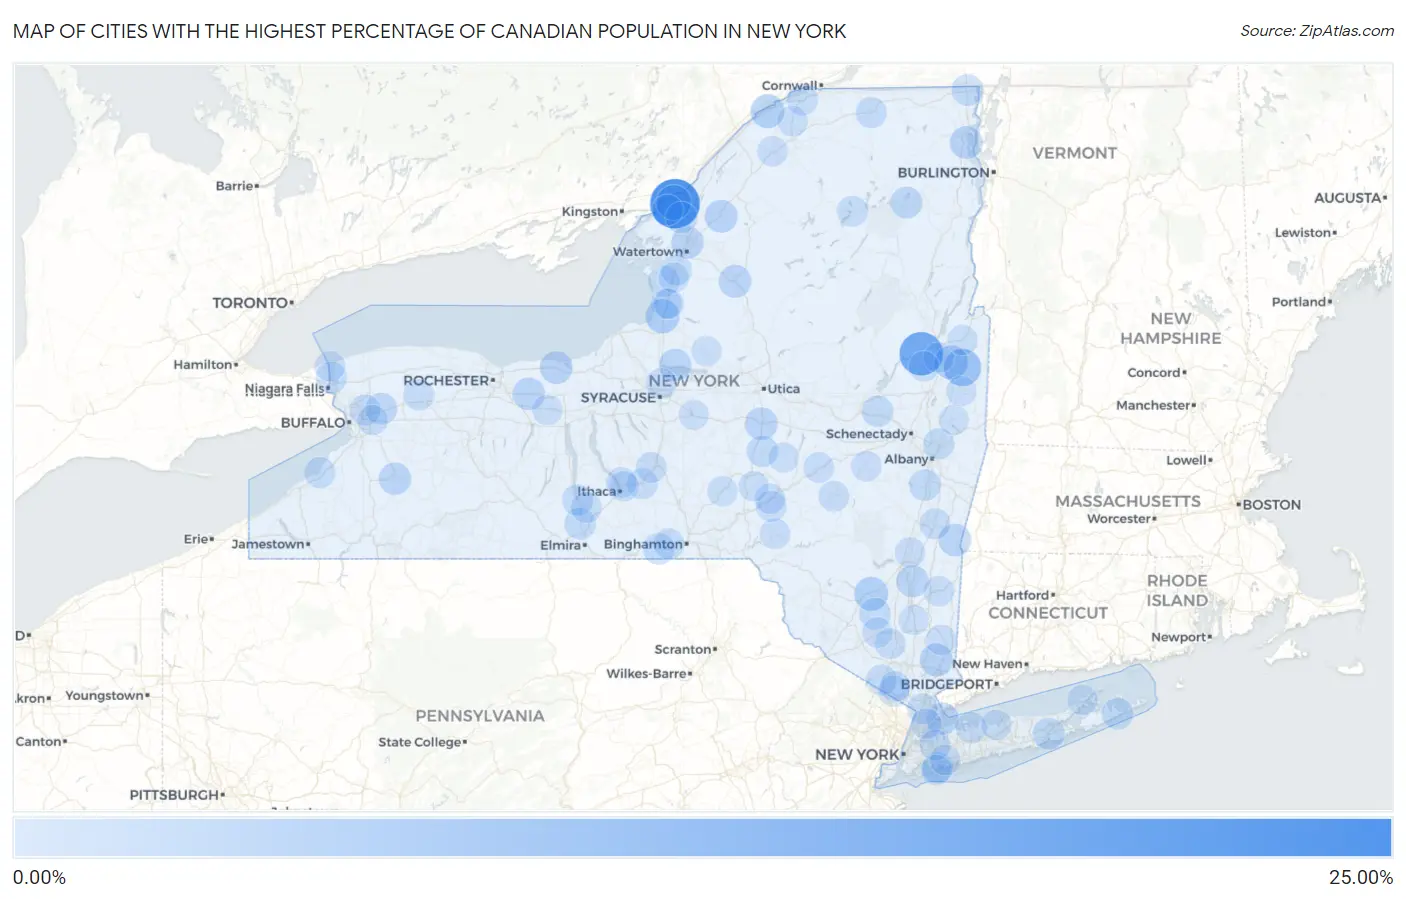
Map of Cities with the Highest Percentage of Canadian Population in New York
0.00%
25.00%
Cities with the Highest Percentage of Canadian Population in New York
| City | Canadian | vs State | vs National | |
| 1. | Fishers Landing | 20.37% | 0.19%(+20.2)#1 | 0.18%(+20.2)#30 |
| 2. | Lake Luzerne | 14.18% | 0.19%(+14.0)#2 | 0.18%(+14.0)#36 |
| 3. | Argyle | 7.92% | 0.19%(+7.74)#3 | 0.18%(+7.75)#52 |
| 4. | South Lansing | 6.26% | 0.19%(+6.08)#4 | 0.18%(+6.09)#71 |
| 5. | Thousand Island Park | 5.56% | 0.19%(+5.37)#5 | 0.18%(+5.38)#87 |
| 6. | Pulaski | 4.78% | 0.19%(+4.60)#6 | 0.18%(+4.61)#105 |
| 7. | Fort Edward | 4.74% | 0.19%(+4.55)#7 | 0.18%(+4.56)#106 |
| 8. | Kerhonkson | 4.56% | 0.19%(+4.38)#8 | 0.18%(+4.38)#113 |
| 9. | Waddington | 4.43% | 0.19%(+4.25)#9 | 0.18%(+4.26)#119 |
| 10. | Lincolndale | 3.86% | 0.19%(+3.67)#10 | 0.18%(+3.68)#151 |
| 11. | Parc | 3.51% | 0.19%(+3.32)#11 | 0.18%(+3.33)#177 |
| 12. | Antwerp | 3.49% | 0.19%(+3.31)#12 | 0.18%(+3.32)#178 |
| 13. | Sodus | 3.44% | 0.19%(+3.26)#13 | 0.18%(+3.26)#184 |
| 14. | Lowville | 3.40% | 0.19%(+3.21)#14 | 0.18%(+3.22)#187 |
| 15. | Bridgewater | 3.35% | 0.19%(+3.16)#15 | 0.18%(+3.17)#189 |
| 16. | Taconic Shores | 3.22% | 0.19%(+3.03)#16 | 0.18%(+3.04)#202 |
| 17. | Macedon | 3.18% | 0.19%(+2.99)#17 | 0.18%(+3.00)#207 |
| 18. | Constantia | 3.17% | 0.19%(+2.98)#18 | 0.18%(+2.99)#208 |
| 19. | Yorkshire | 3.12% | 0.19%(+2.93)#19 | 0.18%(+2.94)#213 |
| 20. | Pamelia Center | 3.12% | 0.19%(+2.93)#20 | 0.18%(+2.94)#214 |
| 21. | Rye | 3.03% | 0.19%(+2.85)#21 | 0.18%(+2.86)#227 |
| 22. | Staatsburg | 2.93% | 0.19%(+2.74)#22 | 0.18%(+2.75)#244 |
| 23. | Eastport | 2.67% | 0.19%(+2.48)#23 | 0.18%(+2.49)#273 |
| 24. | Lake Placid | 2.63% | 0.19%(+2.44)#24 | 0.18%(+2.45)#282 |
| 25. | Clarence | 2.46% | 0.19%(+2.27)#25 | 0.18%(+2.28)#297 |
| 26. | Ravena | 2.42% | 0.19%(+2.24)#26 | 0.18%(+2.25)#305 |
| 27. | Watchtower | 2.39% | 0.19%(+2.20)#27 | 0.18%(+2.21)#312 |
| 28. | Amagansett | 2.36% | 0.19%(+2.17)#28 | 0.18%(+2.18)#317 |
| 29. | Pine Valley | 2.30% | 0.19%(+2.11)#29 | 0.18%(+2.12)#329 |
| 30. | Edmeston | 2.26% | 0.19%(+2.08)#30 | 0.18%(+2.09)#334 |
| 31. | La Fargeville | 2.26% | 0.19%(+2.08)#31 | 0.18%(+2.09)#335 |
| 32. | Woodsburgh | 2.25% | 0.19%(+2.07)#32 | 0.18%(+2.08)#336 |
| 33. | Apalachin | 2.21% | 0.19%(+2.02)#33 | 0.18%(+2.03)#346 |
| 34. | Champlain | 2.19% | 0.19%(+2.01)#34 | 0.18%(+2.02)#352 |
| 35. | Fort Johnson | 2.16% | 0.19%(+1.97)#35 | 0.18%(+1.98)#365 |
| 36. | Belleville | 2.08% | 0.19%(+1.89)#36 | 0.18%(+1.90)#390 |
| 37. | Lewiston | 2.01% | 0.19%(+1.82)#37 | 0.18%(+1.83)#405 |
| 38. | Watkins Glen | 1.91% | 0.19%(+1.73)#38 | 0.18%(+1.73)#434 |
| 39. | Sunset Bay | 1.91% | 0.19%(+1.73)#39 | 0.18%(+1.73)#435 |
| 40. | Green Island | 1.89% | 0.19%(+1.70)#40 | 0.18%(+1.71)#443 |
| 41. | Malone | 1.83% | 0.19%(+1.65)#41 | 0.18%(+1.66)#468 |
| 42. | Williamsville | 1.79% | 0.19%(+1.61)#42 | 0.18%(+1.61)#481 |
| 43. | Adams Center | 1.76% | 0.19%(+1.57)#43 | 0.18%(+1.58)#488 |
| 44. | Tupper Lake | 1.75% | 0.19%(+1.56)#44 | 0.18%(+1.57)#496 |
| 45. | Viola | 1.75% | 0.19%(+1.56)#45 | 0.18%(+1.57)#497 |
| 46. | University Gardens | 1.73% | 0.19%(+1.54)#46 | 0.18%(+1.55)#506 |
| 47. | Tuxedo Park | 1.71% | 0.19%(+1.53)#47 | 0.18%(+1.54)#511 |
| 48. | Halesite | 1.70% | 0.19%(+1.51)#48 | 0.18%(+1.52)#514 |
| 49. | North Syracuse | 1.65% | 0.19%(+1.46)#49 | 0.18%(+1.47)#531 |
| 50. | Claverack Red Mills | 1.63% | 0.19%(+1.44)#50 | 0.18%(+1.45)#540 |
| 51. | Odessa | 1.63% | 0.19%(+1.44)#51 | 0.18%(+1.45)#543 |
| 52. | Ardsley | 1.62% | 0.19%(+1.43)#52 | 0.18%(+1.44)#548 |
| 53. | Clayton | 1.61% | 0.19%(+1.42)#53 | 0.18%(+1.43)#553 |
| 54. | Endicott | 1.61% | 0.19%(+1.42)#54 | 0.18%(+1.43)#554 |
| 55. | Oakfield | 1.60% | 0.19%(+1.42)#55 | 0.18%(+1.43)#556 |
| 56. | Massena | 1.60% | 0.19%(+1.41)#56 | 0.18%(+1.42)#562 |
| 57. | Dryden | 1.58% | 0.19%(+1.39)#57 | 0.18%(+1.40)#574 |
| 58. | Stamford | 1.56% | 0.19%(+1.37)#58 | 0.18%(+1.38)#584 |
| 59. | Franklin | 1.56% | 0.19%(+1.37)#59 | 0.18%(+1.38)#585 |
| 60. | Lansing | 1.55% | 0.19%(+1.36)#60 | 0.18%(+1.37)#588 |
| 61. | Cortland West | 1.54% | 0.19%(+1.35)#61 | 0.18%(+1.36)#594 |
| 62. | Worcester | 1.50% | 0.19%(+1.31)#62 | 0.18%(+1.32)#618 |
| 63. | Beaver Dam Lake | 1.43% | 0.19%(+1.24)#63 | 0.18%(+1.25)#655 |
| 64. | Sandy Creek | 1.41% | 0.19%(+1.22)#64 | 0.18%(+1.23)#666 |
| 65. | Walton | 1.39% | 0.19%(+1.20)#65 | 0.18%(+1.21)#680 |
| 66. | West Glens Falls | 1.34% | 0.19%(+1.15)#66 | 0.18%(+1.16)#720 |
| 67. | Lawrence | 1.33% | 0.19%(+1.14)#67 | 0.18%(+1.15)#727 |
| 68. | Rockville Centre | 1.33% | 0.19%(+1.14)#68 | 0.18%(+1.15)#730 |
| 69. | Middleburgh | 1.32% | 0.19%(+1.13)#69 | 0.18%(+1.14)#732 |
| 70. | Glasco | 1.31% | 0.19%(+1.12)#70 | 0.18%(+1.13)#739 |
| 71. | Otego | 1.30% | 0.19%(+1.11)#71 | 0.18%(+1.12)#745 |
| 72. | Pelham | 1.29% | 0.19%(+1.11)#72 | 0.18%(+1.12)#748 |
| 73. | Lake Carmel | 1.29% | 0.19%(+1.10)#73 | 0.18%(+1.11)#756 |
| 74. | Canton | 1.28% | 0.19%(+1.10)#74 | 0.18%(+1.11)#759 |
| 75. | Norfolk | 1.27% | 0.19%(+1.08)#75 | 0.18%(+1.09)#778 |
| 76. | Montgomery | 1.26% | 0.19%(+1.08)#76 | 0.18%(+1.09)#780 |
| 77. | Northeast Ithaca | 1.26% | 0.19%(+1.07)#77 | 0.18%(+1.08)#785 |
| 78. | Southold | 1.24% | 0.19%(+1.05)#78 | 0.18%(+1.06)#801 |
| 79. | Millbrook | 1.23% | 0.19%(+1.04)#79 | 0.18%(+1.05)#806 |
| 80. | Wesley Hills | 1.22% | 0.19%(+1.04)#80 | 0.18%(+1.05)#808 |
| 81. | Youngstown | 1.22% | 0.19%(+1.03)#81 | 0.18%(+1.04)#811 |
| 82. | Oxford | 1.21% | 0.19%(+1.03)#82 | 0.18%(+1.04)#818 |
| 83. | Corinth | 1.21% | 0.19%(+1.02)#83 | 0.18%(+1.03)#825 |
| 84. | New Hamburg | 1.19% | 0.19%(+1.01)#84 | 0.18%(+1.02)#836 |
| 85. | Gilbertsville | 1.19% | 0.19%(+1.000)#85 | 0.18%(+1.01)#845 |
| 86. | Nissequogue | 1.18% | 0.19%(+0.994)#86 | 0.18%(+1.00)#848 |
| 87. | Lancaster | 1.18% | 0.19%(+0.994)#87 | 0.18%(+1.00)#849 |
| 88. | Clifton Springs | 1.18% | 0.19%(+0.988)#88 | 0.18%(+0.997)#859 |
| 89. | Fort Ann | 1.17% | 0.19%(+0.987)#89 | 0.18%(+0.996)#861 |
| 90. | Hartwick | 1.13% | 0.19%(+0.943)#90 | 0.18%(+0.952)#898 |
| 91. | Camden | 1.12% | 0.19%(+0.937)#91 | 0.18%(+0.947)#906 |
| 92. | Adams | 1.09% | 0.19%(+0.905)#92 | 0.18%(+0.914)#933 |
| 93. | Valley Falls | 1.08% | 0.19%(+0.897)#93 | 0.18%(+0.906)#944 |
| 94. | Greenwich | 1.04% | 0.19%(+0.857)#94 | 0.18%(+0.866)#971 |
| 95. | Brewster Heights | 1.03% | 0.19%(+0.843)#95 | 0.18%(+0.852)#989 |
| 96. | Lacona | 1.02% | 0.19%(+0.836)#96 | 0.18%(+0.845)#997 |
| 97. | Wappingers Falls | 1.02% | 0.19%(+0.834)#97 | 0.18%(+0.843)#999 |
| 98. | Springwater | 1.02% | 0.19%(+0.828)#98 | 0.18%(+0.837)#1,008 |
| 99. | Cazenovia | 1.01% | 0.19%(+0.825)#99 | 0.18%(+0.834)#1,010 |
| 100. | Highland-On-The-Lake | 1.00% | 0.19%(+0.810)#100 | 0.18%(+0.819)#1,025 |
Common Questions
What are the Top 10 Cities with the Highest Percentage of Canadian Population in New York?
Top 10 Cities with the Highest Percentage of Canadian Population in New York are:
#1
20.37%
#2
14.18%
#3
7.92%
#4
5.56%
#5
4.78%
#6
4.74%
#7
4.56%
#8
4.43%
#9
3.86%
#10
3.51%
What city has the Highest Percentage of Canadian Population in New York?
Fishers Landing has the Highest Percentage of Canadian Population in New York with 20.37%.
What is the Percentage of Canadian Population in the State of New York?
Percentage of Canadian Population in New York is 0.19%.
What is the Percentage of Canadian Population in the United States?
Percentage of Canadian Population in the United States is 0.18%.