Cities with the Highest Percentage of Canadian Population in Connecticut
RELATED REPORTS & OPTIONS
Canadian
Connecticut
Compare Cities
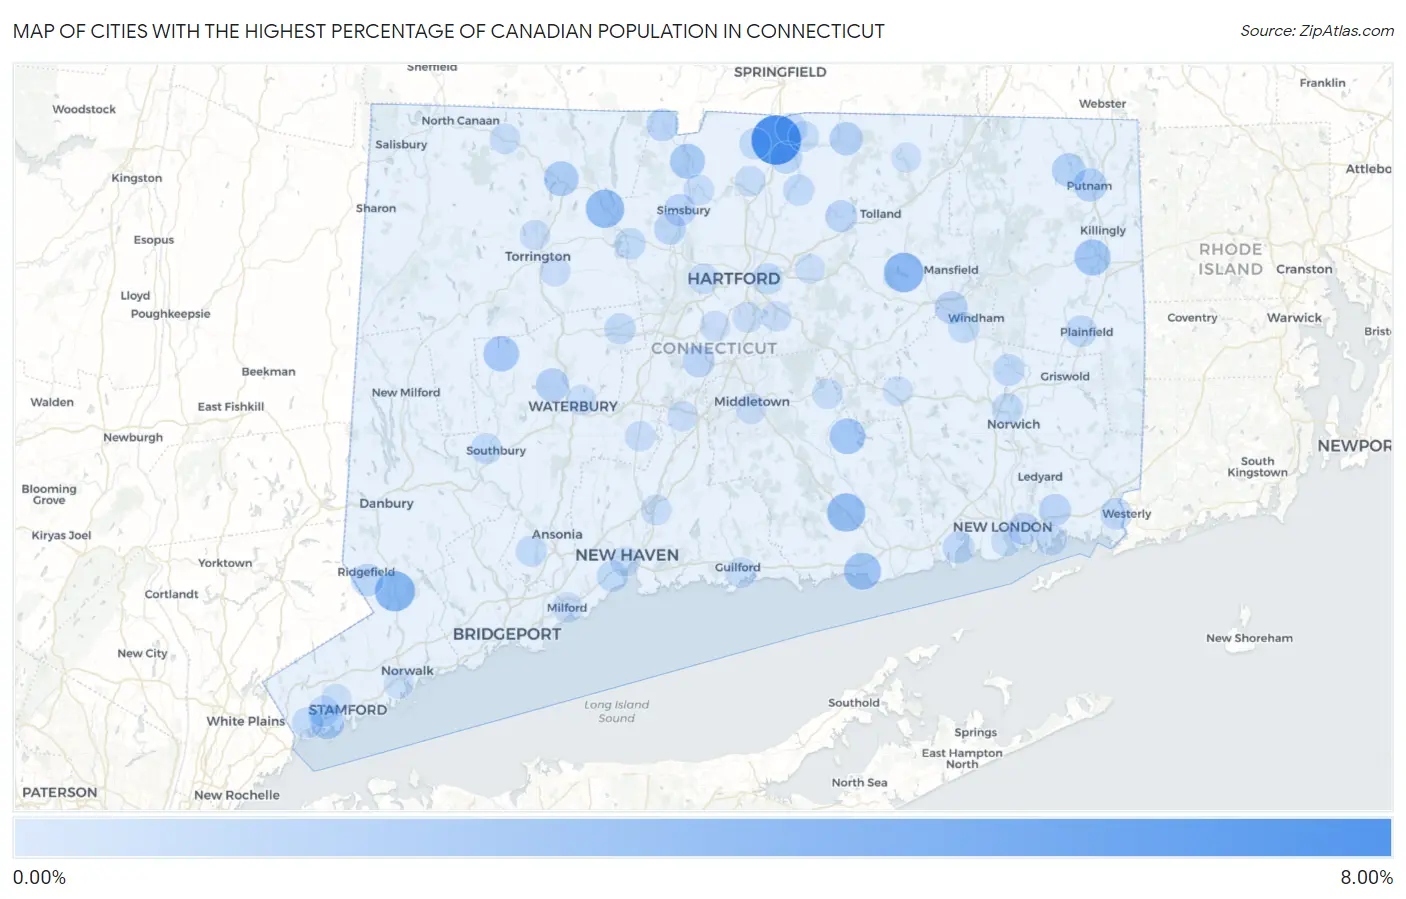
Map of Cities with the Highest Percentage of Canadian Population in Connecticut
0.00%
8.00%
Cities with the Highest Percentage of Canadian Population in Connecticut
| City | Canadian | vs State | vs National | |
| 1. | Thompsonville | 6.50% | 0.37%(+6.13)#1 | 0.18%(+6.32)#68 |
| 2. | Witches Woods | 3.53% | 0.37%(+3.16)#2 | 0.18%(+3.35)#174 |
| 3. | Georgetown | 3.38% | 0.37%(+3.01)#3 | 0.18%(+3.20)#188 |
| 4. | South Coventry | 3.20% | 0.37%(+2.83)#4 | 0.18%(+3.02)#204 |
| 5. | Indian Field | 2.88% | 0.37%(+2.51)#5 | 0.18%(+2.70)#249 |
| 6. | New Hartford Center | 2.79% | 0.37%(+2.42)#6 | 0.18%(+2.61)#259 |
| 7. | Bigelow Corners | 2.78% | 0.37%(+2.41)#7 | 0.18%(+2.60)#260 |
| 8. | Deep River Center | 2.74% | 0.37%(+2.37)#8 | 0.18%(+2.56)#263 |
| 9. | Woodmont Borough | 2.47% | 0.37%(+2.10)#9 | 0.18%(+2.29)#296 |
| 10. | Redding Center | 2.33% | 0.37%(+1.96)#10 | 0.18%(+2.15)#323 |
| 11. | Saybrook Manor | 2.27% | 0.37%(+1.90)#11 | 0.18%(+2.10)#331 |
| 12. | Darien Downtown | 2.21% | 0.37%(+1.84)#12 | 0.18%(+2.03)#345 |
| 13. | East Brooklyn | 2.05% | 0.37%(+1.68)#13 | 0.18%(+1.87)#395 |
| 14. | Westport | 1.99% | 0.37%(+1.62)#14 | 0.18%(+1.81)#410 |
| 15. | Moodus | 1.92% | 0.37%(+1.55)#15 | 0.18%(+1.74)#426 |
| 16. | Rock Ridge | 1.91% | 0.37%(+1.54)#16 | 0.18%(+1.74)#433 |
| 17. | Bethlehem Village | 1.85% | 0.37%(+1.48)#17 | 0.18%(+1.68)#458 |
| 18. | Ridgebury | 1.83% | 0.37%(+1.46)#18 | 0.18%(+1.65)#469 |
| 19. | Salmon Brook | 1.69% | 0.37%(+1.32)#19 | 0.18%(+1.52)#518 |
| 20. | Stepney | 1.63% | 0.37%(+1.26)#20 | 0.18%(+1.45)#539 |
| 21. | Tokeneke | 1.63% | 0.37%(+1.26)#21 | 0.18%(+1.45)#541 |
| 22. | Winsted | 1.60% | 0.37%(+1.23)#22 | 0.18%(+1.42)#559 |
| 23. | Candlewood Orchards | 1.53% | 0.37%(+1.16)#23 | 0.18%(+1.35)#601 |
| 24. | Route 7 Gateway | 1.39% | 0.37%(+1.02)#24 | 0.18%(+1.21)#678 |
| 25. | Riverside | 1.28% | 0.37%(+0.906)#25 | 0.18%(+1.10)#767 |
| 26. | South Woodstock | 1.27% | 0.37%(+0.899)#26 | 0.18%(+1.09)#773 |
| 27. | Somers | 1.17% | 0.37%(+0.795)#27 | 0.18%(+0.987)#866 |
| 28. | Oakville | 1.16% | 0.37%(+0.791)#28 | 0.18%(+0.983)#869 |
| 29. | Putnam | 1.15% | 0.37%(+0.782)#29 | 0.18%(+0.973)#881 |
| 30. | Oronoque | 1.13% | 0.37%(+0.762)#30 | 0.18%(+0.953)#896 |
| 31. | Staples | 1.06% | 0.37%(+0.686)#31 | 0.18%(+0.877)#961 |
| 32. | Inglenook | 1.02% | 0.37%(+0.647)#32 | 0.18%(+0.838)#1,007 |
| 33. | Willimantic | 1.01% | 0.37%(+0.638)#33 | 0.18%(+0.829)#1,014 |
| 34. | Ridgefield | 0.90% | 0.37%(+0.531)#34 | 0.18%(+0.723)#1,144 |
| 35. | North Granby | 0.90% | 0.37%(+0.530)#35 | 0.18%(+0.721)#1,148 |
| 36. | New Canaan | 0.83% | 0.37%(+0.461)#36 | 0.18%(+0.652)#1,274 |
| 37. | Southwood Acres | 0.79% | 0.37%(+0.425)#37 | 0.18%(+0.616)#1,343 |
| 38. | Kensington | 0.79% | 0.37%(+0.423)#38 | 0.18%(+0.615)#1,346 |
| 39. | Old Mystic | 0.77% | 0.37%(+0.398)#39 | 0.18%(+0.590)#1,407 |
| 40. | Rockville | 0.76% | 0.37%(+0.392)#40 | 0.18%(+0.584)#1,423 |
| 41. | Simsbury Center | 0.75% | 0.37%(+0.383)#41 | 0.18%(+0.574)#1,446 |
| 42. | Weatogue | 0.75% | 0.37%(+0.379)#42 | 0.18%(+0.570)#1,455 |
| 43. | Long Hill | 0.73% | 0.37%(+0.360)#43 | 0.18%(+0.552)#1,493 |
| 44. | Niantic | 0.71% | 0.37%(+0.345)#44 | 0.18%(+0.537)#1,530 |
| 45. | Baltic | 0.70% | 0.37%(+0.326)#45 | 0.18%(+0.517)#1,586 |
| 46. | Lakes East | 0.69% | 0.37%(+0.316)#46 | 0.18%(+0.508)#1,612 |
| 47. | Pawcatuck | 0.66% | 0.37%(+0.294)#47 | 0.18%(+0.486)#1,667 |
| 48. | Noroton | 0.66% | 0.37%(+0.290)#48 | 0.18%(+0.482)#1,677 |
| 49. | Plainfield Village | 0.63% | 0.37%(+0.264)#49 | 0.18%(+0.456)#1,751 |
| 50. | Sherwood Manor | 0.59% | 0.37%(+0.223)#50 | 0.18%(+0.415)#1,857 |
| 51. | Collinsville | 0.59% | 0.37%(+0.217)#51 | 0.18%(+0.408)#1,875 |
| 52. | East Hartford | 0.56% | 0.37%(+0.191)#52 | 0.18%(+0.383)#1,963 |
| 53. | Greens Farms | 0.56% | 0.37%(+0.187)#53 | 0.18%(+0.379)#1,976 |
| 54. | Norwich | 0.55% | 0.37%(+0.179)#54 | 0.18%(+0.371)#2,016 |
| 55. | Bristol | 0.54% | 0.37%(+0.171)#55 | 0.18%(+0.362)#2,047 |
| 56. | Suffield Depot | 0.53% | 0.37%(+0.160)#56 | 0.18%(+0.352)#2,086 |
| 57. | West Haven | 0.53% | 0.37%(+0.158)#57 | 0.18%(+0.349)#2,099 |
| 58. | Broad Brook | 0.52% | 0.37%(+0.154)#58 | 0.18%(+0.346)#2,111 |
| 59. | Cos Cob | 0.50% | 0.37%(+0.127)#59 | 0.18%(+0.319)#2,231 |
| 60. | South Windham | 0.50% | 0.37%(+0.126)#60 | 0.18%(+0.317)#2,238 |
| 61. | Heritage Village | 0.48% | 0.37%(+0.106)#61 | 0.18%(+0.298)#2,310 |
| 62. | Litchfield Borough | 0.44% | 0.37%(+0.073)#62 | 0.18%(+0.264)#2,479 |
| 63. | Lakes West | 0.44% | 0.37%(+0.072)#63 | 0.18%(+0.263)#2,483 |
| 64. | Greenwich | 0.43% | 0.37%(+0.057)#64 | 0.18%(+0.249)#2,557 |
| 65. | Shelton | 0.42% | 0.37%(+0.050)#65 | 0.18%(+0.241)#2,603 |
| 66. | Sacred Heart University | 0.39% | 0.37%(+0.024)#66 | 0.18%(+0.216)#2,750 |
| 67. | Tariffville | 0.39% | 0.37%(+0.018)#67 | 0.18%(+0.210)#2,793 |
| 68. | Naugatuck Borough | 0.36% | 0.37%(-0.010)#68 | 0.18%(+0.182)#2,982 |
| 69. | East | 0.36% | 0.37%(-0.012)#69 | 0.18%(+0.180)#2,993 |
| 70. | Trumbull Center | 0.36% | 0.37%(-0.012)#70 | 0.18%(+0.180)#2,994 |
| 71. | Noank | 0.35% | 0.37%(-0.019)#71 | 0.18%(+0.173)#3,038 |
| 72. | Windsor Locks | 0.33% | 0.37%(-0.036)#72 | 0.18%(+0.156)#3,165 |
| 73. | Hazardville | 0.33% | 0.37%(-0.043)#73 | 0.18%(+0.148)#3,225 |
| 74. | West Hartford | 0.33% | 0.37%(-0.044)#74 | 0.18%(+0.148)#3,229 |
| 75. | North Haven | 0.32% | 0.37%(-0.052)#75 | 0.18%(+0.140)#3,277 |
| 76. | Guilford Center | 0.31% | 0.37%(-0.055)#76 | 0.18%(+0.136)#3,309 |
| 77. | Norfolk | 0.31% | 0.37%(-0.063)#77 | 0.18%(+0.128)#3,368 |
| 78. | East Hampton | 0.31% | 0.37%(-0.064)#78 | 0.18%(+0.127)#3,381 |
| 79. | Milford City Balance | 0.30% | 0.37%(-0.068)#79 | 0.18%(+0.124)#3,413 |
| 80. | Middletown | 0.29% | 0.37%(-0.079)#80 | 0.18%(+0.112)#3,513 |
| 81. | Newington | 0.28% | 0.37%(-0.088)#81 | 0.18%(+0.104)#3,589 |
| 82. | Ball Pond | 0.28% | 0.37%(-0.093)#82 | 0.18%(+0.098)#3,639 |
| 83. | Wethersfield | 0.26% | 0.37%(-0.105)#83 | 0.18%(+0.086)#3,754 |
| 84. | Glastonbury Center | 0.26% | 0.37%(-0.106)#84 | 0.18%(+0.085)#3,761 |
| 85. | Torrington | 0.26% | 0.37%(-0.114)#85 | 0.18%(+0.078)#3,841 |
| 86. | Meriden | 0.26% | 0.37%(-0.114)#86 | 0.18%(+0.078)#3,845 |
| 87. | Newtown Borough | 0.26% | 0.37%(-0.115)#87 | 0.18%(+0.077)#3,852 |
| 88. | Cheshire Village | 0.26% | 0.37%(-0.115)#88 | 0.18%(+0.077)#3,856 |
| 89. | Fairfield University | 0.25% | 0.37%(-0.118)#89 | 0.18%(+0.074)#3,886 |
| 90. | Waterbury | 0.24% | 0.37%(-0.129)#90 | 0.18%(+0.063)#3,993 |
| 91. | Northwest Harwinton | 0.22% | 0.37%(-0.151)#91 | 0.18%(+0.040)#4,278 |
| 92. | Northford | 0.21% | 0.37%(-0.160)#92 | 0.18%(+0.032)#4,361 |
| 93. | New London | 0.21% | 0.37%(-0.163)#93 | 0.18%(+0.028)#4,427 |
| 94. | New Haven | 0.19% | 0.37%(-0.183)#94 | 0.18%(+0.009)#4,658 |
| 95. | Compo | 0.16% | 0.37%(-0.205)#95 | 0.18%(-0.013)#4,929 |
| 96. | Manchester | 0.16% | 0.37%(-0.211)#96 | 0.18%(-0.019)#4,995 |
| 97. | Norwalk | 0.14% | 0.37%(-0.225)#97 | 0.18%(-0.033)#5,197 |
| 98. | Colchester | 0.14% | 0.37%(-0.226)#98 | 0.18%(-0.035)#5,212 |
| 99. | Stafford Springs | 0.14% | 0.37%(-0.227)#99 | 0.18%(-0.035)#5,219 |
| 100. | Stamford | 0.14% | 0.37%(-0.228)#100 | 0.18%(-0.037)#5,235 |
Common Questions
What are the Top 10 Cities with the Highest Percentage of Canadian Population in Connecticut?
Top 10 Cities with the Highest Percentage of Canadian Population in Connecticut are:
#1
6.50%
#2
3.38%
#3
3.20%
#4
2.79%
#5
2.74%
#6
2.27%
#7
2.05%
#8
1.92%
#9
1.85%
#10
1.69%
What city has the Highest Percentage of Canadian Population in Connecticut?
Thompsonville has the Highest Percentage of Canadian Population in Connecticut with 6.50%.
What is the Percentage of Canadian Population in the State of Connecticut?
Percentage of Canadian Population in Connecticut is 0.37%.
What is the Percentage of Canadian Population in the United States?
Percentage of Canadian Population in the United States is 0.18%.