Cities with the Highest Percentage of Households Heated by Fuel Oil / Kerosene in Massachusetts
RELATED REPORTS & OPTIONS
Fuel Oil Heating
Massachusetts
Compare Cities
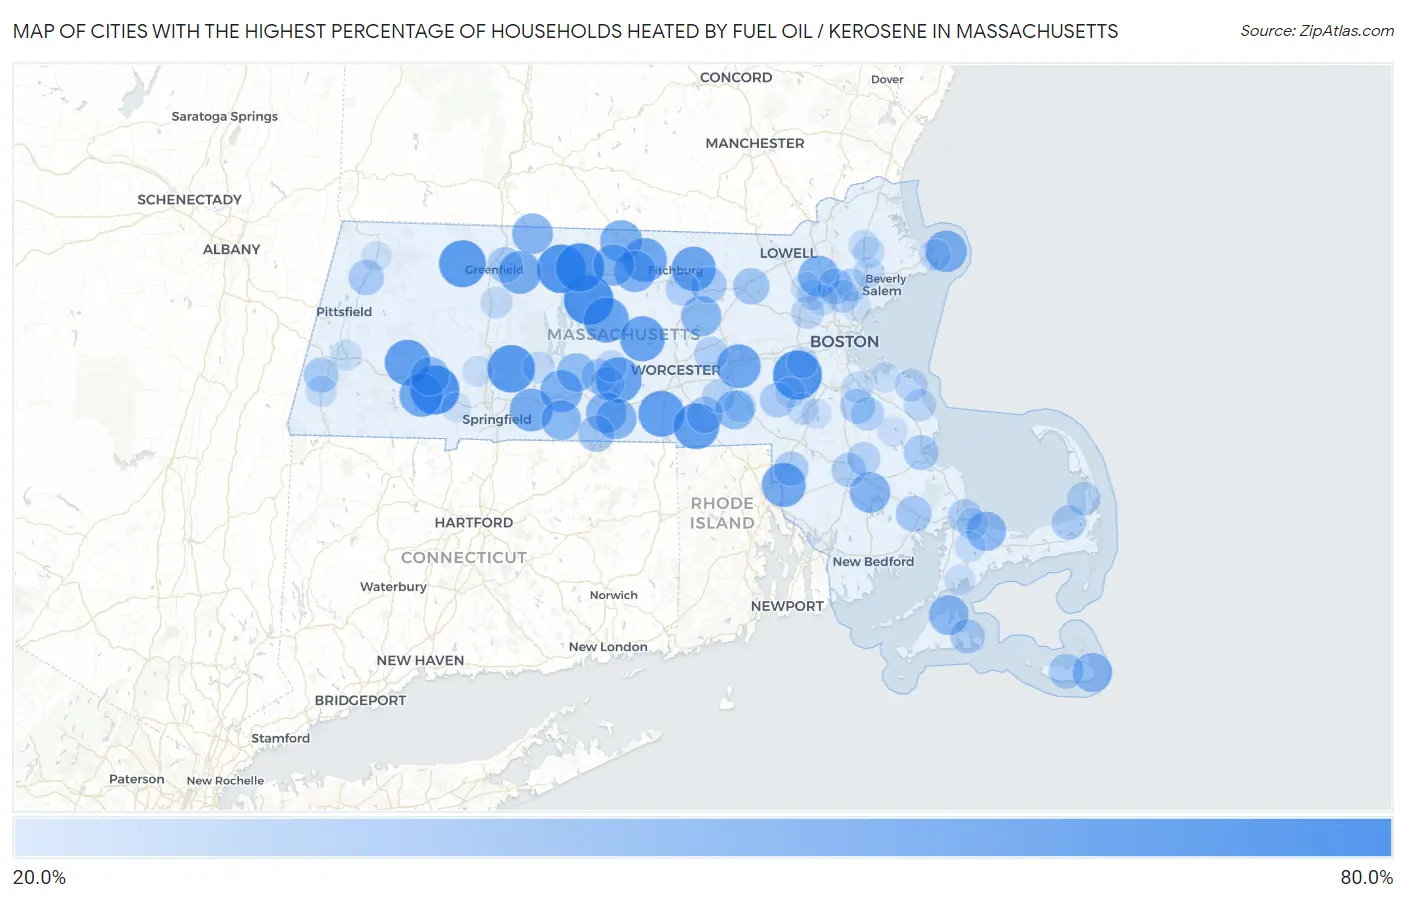
Map of Cities with the Highest Percentage of Households Heated by Fuel Oil / Kerosene in Massachusetts
0.0%
80.0%
Cities with the Highest Percentage of Households Heated by Fuel Oil / Kerosene in Massachusetts
| City | Fuel Oil Heating | vs State | vs National | |
| 1. | Petersham | 78.8% | 23.8%(+55.0)#1 | 4.2%(+74.6)#346 |
| 2. | Dover | 77.5% | 23.8%(+53.7)#2 | 4.2%(+73.3)#383 |
| 3. | Russell | 77.3% | 23.8%(+53.5)#3 | 4.2%(+73.1)#387 |
| 4. | Orange | 76.3% | 23.8%(+52.5)#4 | 4.2%(+72.1)#412 |
| 5. | Athol | 76.1% | 23.8%(+52.3)#5 | 4.2%(+71.9)#418 |
| 6. | Granby | 73.9% | 23.8%(+50.1)#6 | 4.2%(+69.7)#486 |
| 7. | Shelburne Falls | 72.1% | 23.8%(+48.3)#7 | 4.2%(+67.9)#552 |
| 8. | Oxford | 69.2% | 23.8%(+45.4)#8 | 4.2%(+65.0)#657 |
| 9. | East Douglas | 68.9% | 23.8%(+45.1)#9 | 4.2%(+64.7)#668 |
| 10. | Chester | 68.5% | 23.8%(+44.7)#10 | 4.2%(+64.3)#688 |
| 11. | East Brookfield | 67.8% | 23.8%(+44.0)#11 | 4.2%(+63.6)#707 |
| 12. | Barre | 67.4% | 23.8%(+43.6)#12 | 4.2%(+63.2)#728 |
| 13. | Rutland | 66.7% | 23.8%(+42.9)#13 | 4.2%(+62.5)#750 |
| 14. | Lunenburg | 65.1% | 23.8%(+41.3)#14 | 4.2%(+60.9)#831 |
| 15. | North Seekonk | 64.5% | 23.8%(+40.7)#15 | 4.2%(+60.3)#856 |
| 16. | Cordaville | 64.1% | 23.8%(+40.3)#16 | 4.2%(+59.9)#876 |
| 17. | South Ashburnham | 64.1% | 23.8%(+40.3)#17 | 4.2%(+59.9)#878 |
| 18. | Blandford | 63.0% | 23.8%(+39.2)#18 | 4.2%(+58.8)#922 |
| 19. | Wilbraham | 61.4% | 23.8%(+37.6)#19 | 4.2%(+57.2)#992 |
| 20. | Millers Falls | 61.1% | 23.8%(+37.3)#20 | 4.2%(+56.9)#1,007 |
| 21. | Palmer Town | 59.4% | 23.8%(+35.6)#21 | 4.2%(+55.2)#1,089 |
| 22. | Winchendon | 59.4% | 23.8%(+35.6)#22 | 4.2%(+55.2)#1,091 |
| 23. | Gardner | 57.8% | 23.8%(+34.0)#23 | 4.2%(+53.6)#1,171 |
| 24. | Rockport | 57.8% | 23.8%(+34.0)#24 | 4.2%(+53.6)#1,172 |
| 25. | Baldwinville | 57.3% | 23.8%(+33.5)#25 | 4.2%(+53.1)#1,189 |
| 26. | Wilmington | 56.7% | 23.8%(+32.9)#26 | 4.2%(+52.5)#1,223 |
| 27. | Northfield | 55.6% | 23.8%(+31.8)#27 | 4.2%(+51.4)#1,270 |
| 28. | North Lakeville | 55.3% | 23.8%(+31.5)#28 | 4.2%(+51.1)#1,284 |
| 29. | Fiskdale | 55.2% | 23.8%(+31.4)#29 | 4.2%(+51.0)#1,289 |
| 30. | Sturbridge | 55.2% | 23.8%(+31.4)#30 | 4.2%(+51.0)#1,290 |
| 31. | South Lancaster | 54.4% | 23.8%(+30.6)#31 | 4.2%(+50.2)#1,328 |
| 32. | Monson Center | 53.3% | 23.8%(+29.5)#32 | 4.2%(+49.1)#1,389 |
| 33. | Vineyard Haven | 52.8% | 23.8%(+29.0)#33 | 4.2%(+48.6)#1,412 |
| 34. | East Sandwich | 52.2% | 23.8%(+28.4)#34 | 4.2%(+48.0)#1,437 |
| 35. | Oak Bluffs | 51.9% | 23.8%(+28.1)#35 | 4.2%(+47.7)#1,459 |
| 36. | Siasconset | 51.9% | 23.8%(+28.1)#36 | 4.2%(+47.7)#1,461 |
| 37. | Huntington | 50.9% | 23.8%(+27.1)#37 | 4.2%(+46.7)#1,507 |
| 38. | Hopedale | 50.8% | 23.8%(+27.0)#38 | 4.2%(+46.6)#1,510 |
| 39. | Ware | 50.7% | 23.8%(+26.9)#39 | 4.2%(+46.5)#1,517 |
| 40. | Whitinsville | 44.6% | 23.8%(+20.8)#40 | 4.2%(+40.4)#1,777 |
| 41. | Littleton Common | 44.5% | 23.8%(+20.7)#41 | 4.2%(+40.3)#1,781 |
| 42. | Holland | 44.4% | 23.8%(+20.6)#42 | 4.2%(+40.2)#1,783 |
| 43. | West Warren | 43.9% | 23.8%(+20.1)#43 | 4.2%(+39.7)#1,807 |
| 44. | North Attleborough | 43.5% | 23.8%(+19.7)#44 | 4.2%(+39.3)#1,822 |
| 45. | Shirley | 43.4% | 23.8%(+19.6)#45 | 4.2%(+39.2)#1,828 |
| 46. | West Wareham | 43.2% | 23.8%(+19.4)#46 | 4.2%(+39.0)#1,839 |
| 47. | Reading | 42.6% | 23.8%(+18.8)#47 | 4.2%(+38.4)#1,873 |
| 48. | Turners Falls | 42.4% | 23.8%(+18.6)#48 | 4.2%(+38.2)#1,888 |
| 49. | Cheshire | 41.8% | 23.8%(+18.0)#49 | 4.2%(+37.6)#1,924 |
| 50. | Kingston | 41.1% | 23.8%(+17.3)#50 | 4.2%(+36.9)#1,950 |
| 51. | Nantucket | 40.8% | 23.8%(+17.0)#51 | 4.2%(+36.6)#1,963 |
| 52. | Millis Clicquot | 40.8% | 23.8%(+17.0)#52 | 4.2%(+36.6)#1,964 |
| 53. | West Brookfield | 40.8% | 23.8%(+17.0)#53 | 4.2%(+36.6)#1,967 |
| 54. | Housatonic | 40.6% | 23.8%(+16.8)#54 | 4.2%(+36.4)#1,981 |
| 55. | Holbrook | 40.5% | 23.8%(+16.7)#55 | 4.2%(+36.3)#1,983 |
| 56. | Attleboro | 39.9% | 23.8%(+16.1)#56 | 4.2%(+35.7)#2,021 |
| 57. | Edgartown | 39.9% | 23.8%(+16.1)#57 | 4.2%(+35.7)#2,026 |
| 58. | Brewster | 39.7% | 23.8%(+15.9)#58 | 4.2%(+35.5)#2,038 |
| 59. | Raynham Center | 39.4% | 23.8%(+15.6)#59 | 4.2%(+35.2)#2,051 |
| 60. | Leominster | 38.8% | 23.8%(+15.0)#60 | 4.2%(+34.6)#2,075 |
| 61. | Sagamore | 38.7% | 23.8%(+14.9)#61 | 4.2%(+34.5)#2,080 |
| 62. | Northborough | 38.6% | 23.8%(+14.8)#62 | 4.2%(+34.4)#2,088 |
| 63. | Brookfield | 38.1% | 23.8%(+14.3)#63 | 4.2%(+33.9)#2,112 |
| 64. | Abington | 37.3% | 23.8%(+13.5)#64 | 4.2%(+33.1)#2,145 |
| 65. | North Eastham | 37.1% | 23.8%(+13.3)#65 | 4.2%(+32.9)#2,152 |
| 66. | Bridgewater Town | 36.9% | 23.8%(+13.1)#66 | 4.2%(+32.7)#2,159 |
| 67. | Upton | 36.8% | 23.8%(+13.0)#67 | 4.2%(+32.6)#2,163 |
| 68. | Lynnfield | 35.5% | 23.8%(+11.7)#68 | 4.2%(+31.3)#2,220 |
| 69. | Wakefield | 35.4% | 23.8%(+11.6)#69 | 4.2%(+31.2)#2,227 |
| 70. | Lexington | 35.3% | 23.8%(+11.5)#70 | 4.2%(+31.1)#2,231 |
| 71. | North Scituate | 34.8% | 23.8%(+11.0)#71 | 4.2%(+30.6)#2,259 |
| 72. | Milford | 34.5% | 23.8%(+10.7)#72 | 4.2%(+30.3)#2,278 |
| 73. | Marshfield Hills | 34.4% | 23.8%(+10.6)#73 | 4.2%(+30.2)#2,283 |
| 74. | Greenfield | 34.2% | 23.8%(+10.4)#74 | 4.2%(+30.0)#2,287 |
| 75. | North Brookfield | 33.5% | 23.8%(+9.70)#75 | 4.2%(+29.3)#2,330 |
| 76. | South Deerfield | 32.8% | 23.8%(+9.00)#76 | 4.2%(+28.6)#2,368 |
| 77. | Gloucester | 32.6% | 23.8%(+8.80)#77 | 4.2%(+28.4)#2,382 |
| 78. | Belchertown | 32.5% | 23.8%(+8.70)#78 | 4.2%(+28.3)#2,388 |
| 79. | Sandwich | 32.3% | 23.8%(+8.50)#79 | 4.2%(+28.1)#2,398 |
| 80. | Needham | 32.2% | 23.8%(+8.40)#80 | 4.2%(+28.0)#2,404 |
| 81. | Walpole | 32.2% | 23.8%(+8.40)#81 | 4.2%(+28.0)#2,406 |
| 82. | Braintree Town | 31.9% | 23.8%(+8.10)#82 | 4.2%(+27.7)#2,420 |
| 83. | Topsfield | 31.8% | 23.8%(+8.00)#83 | 4.2%(+27.6)#2,431 |
| 84. | Great Barrington | 31.8% | 23.8%(+8.00)#84 | 4.2%(+27.6)#2,435 |
| 85. | Danvers | 31.5% | 23.8%(+7.70)#85 | 4.2%(+27.3)#2,451 |
| 86. | Woburn | 31.2% | 23.8%(+7.40)#86 | 4.2%(+27.0)#2,469 |
| 87. | Burlington | 31.0% | 23.8%(+7.20)#87 | 4.2%(+26.8)#2,483 |
| 88. | Lee | 31.0% | 23.8%(+7.20)#88 | 4.2%(+26.8)#2,487 |
| 89. | Forestdale | 30.9% | 23.8%(+7.10)#89 | 4.2%(+26.7)#2,498 |
| 90. | Pinehurst | 30.6% | 23.8%(+6.80)#90 | 4.2%(+26.4)#2,515 |
| 91. | Boxford | 30.5% | 23.8%(+6.70)#91 | 4.2%(+26.3)#2,519 |
| 92. | East Falmouth | 30.3% | 23.8%(+6.50)#92 | 4.2%(+26.1)#2,528 |
| 93. | Easthampton Town | 30.2% | 23.8%(+6.40)#93 | 4.2%(+26.0)#2,535 |
| 94. | Medfield | 30.2% | 23.8%(+6.40)#94 | 4.2%(+26.0)#2,536 |
| 95. | Hingham | 30.1% | 23.8%(+6.30)#95 | 4.2%(+25.9)#2,545 |
| 96. | Hanson | 29.4% | 23.8%(+5.60)#96 | 4.2%(+25.2)#2,595 |
| 97. | Sharon | 29.1% | 23.8%(+5.30)#97 | 4.2%(+24.9)#2,618 |
| 98. | Adams | 28.9% | 23.8%(+5.10)#98 | 4.2%(+24.7)#2,622 |
| 99. | Saugus | 28.4% | 23.8%(+4.60)#99 | 4.2%(+24.2)#2,650 |
| 100. | Westfield | 28.3% | 23.8%(+4.50)#100 | 4.2%(+24.1)#2,656 |
Common Questions
What are the Top 10 Cities with the Highest Percentage of Households Heated by Fuel Oil / Kerosene in Massachusetts?
Top 10 Cities with the Highest Percentage of Households Heated by Fuel Oil / Kerosene in Massachusetts are:
#1
78.8%
#2
77.5%
#3
77.3%
#4
76.3%
#5
76.1%
#6
73.9%
#7
72.1%
#8
69.2%
#9
68.9%
#10
68.5%
What city has the Highest Percentage of Households Heated by Fuel Oil / Kerosene in Massachusetts?
Petersham has the Highest Percentage of Households Heated by Fuel Oil / Kerosene in Massachusetts with 78.8%.
What is the Percentage of Households Heated by Fuel Oil / Kerosene in the State of Massachusetts?
Percentage of Households Heated by Fuel Oil / Kerosene in Massachusetts is 23.8%.
What is the Percentage of Households Heated by Fuel Oil / Kerosene in the United States?
Percentage of Households Heated by Fuel Oil / Kerosene in the United States is 4.2%.