Cities with the Highest Percentage of Households Heated by Fuel Oil / Kerosene in New York
RELATED REPORTS & OPTIONS
Fuel Oil Heating
New York
Compare Cities
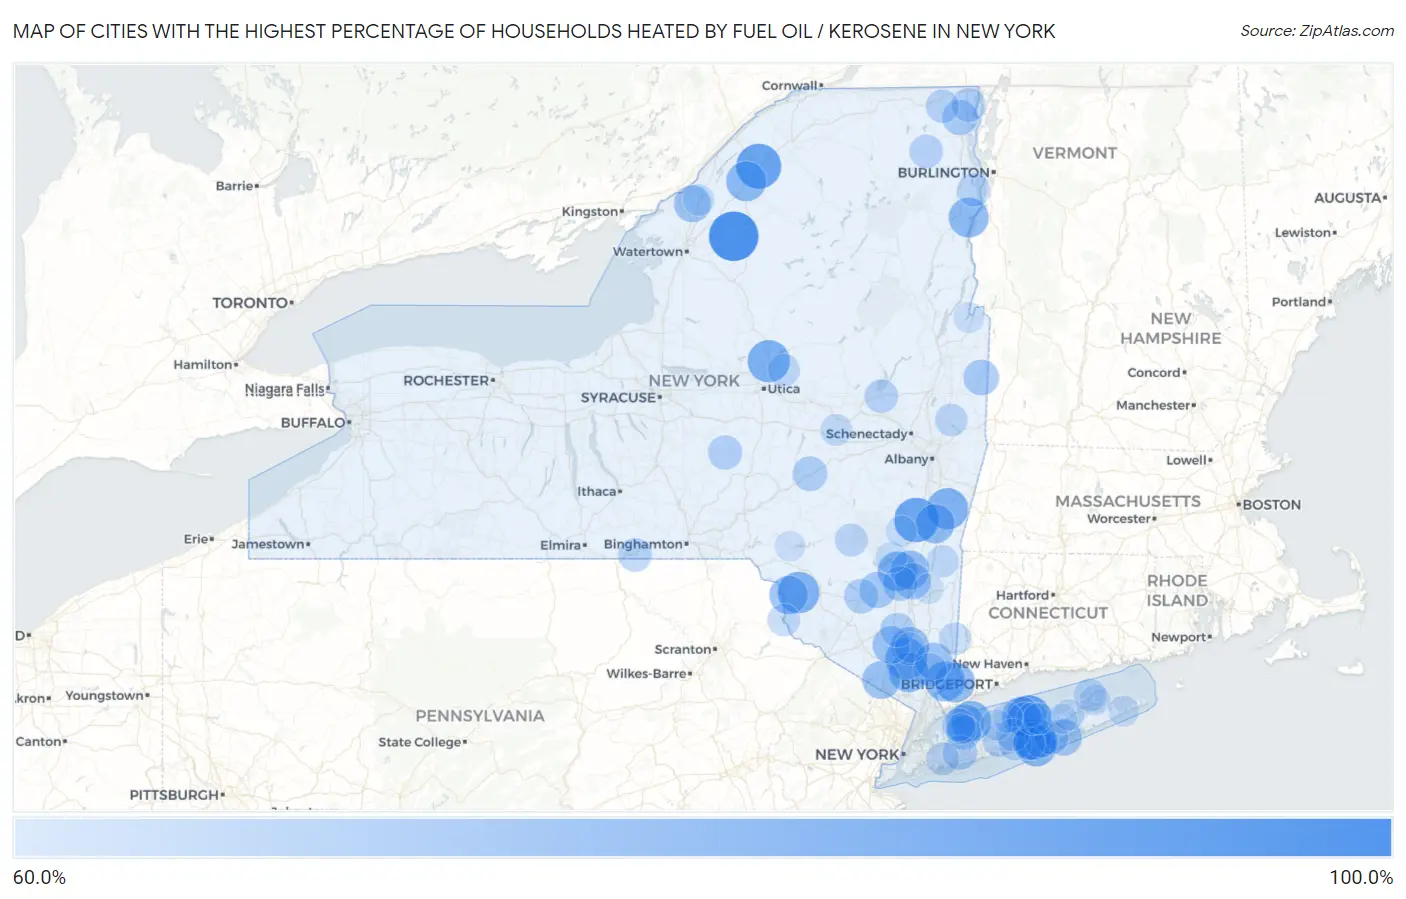
Map of Cities with the Highest Percentage of Households Heated by Fuel Oil / Kerosene in New York
0.0%
100.0%
Cities with the Highest Percentage of Households Heated by Fuel Oil / Kerosene in New York
| City | Fuel Oil Heating | vs State | vs National | |
| 1. | Natural Bridge | 100.0% | 17.9%(+82.1)#1 | 4.2%(+95.8)#20 |
| 2. | Barrytown | 100.0% | 17.9%(+82.1)#2 | 4.2%(+95.8)#35 |
| 3. | Woodbourne | 95.0% | 17.9%(+77.1)#3 | 4.2%(+90.8)#129 |
| 4. | Dekalb Junction | 92.5% | 17.9%(+74.6)#4 | 4.2%(+88.3)#152 |
| 5. | Leeds | 92.0% | 17.9%(+74.1)#5 | 4.2%(+87.8)#155 |
| 6. | Shoreham | 91.9% | 17.9%(+74.0)#6 | 4.2%(+87.7)#158 |
| 7. | Millwood | 89.0% | 17.9%(+71.1)#7 | 4.2%(+84.8)#181 |
| 8. | Barneveld | 88.1% | 17.9%(+70.2)#8 | 4.2%(+83.9)#189 |
| 9. | Mastic | 87.8% | 17.9%(+69.9)#9 | 4.2%(+83.6)#190 |
| 10. | Macdonnell Heights | 87.3% | 17.9%(+69.4)#10 | 4.2%(+83.1)#199 |
| 11. | Jeffersonville | 86.9% | 17.9%(+69.0)#11 | 4.2%(+82.7)#205 |
| 12. | Fort Montgomery | 86.7% | 17.9%(+68.8)#12 | 4.2%(+82.5)#208 |
| 13. | Ghent | 86.6% | 17.9%(+68.7)#13 | 4.2%(+82.4)#210 |
| 14. | Eatons Neck | 85.2% | 17.9%(+67.3)#14 | 4.2%(+81.0)#225 |
| 15. | Mastic Beach | 85.0% | 17.9%(+67.1)#15 | 4.2%(+80.8)#228 |
| 16. | New Hamburg | 85.0% | 17.9%(+67.1)#16 | 4.2%(+80.8)#229 |
| 17. | Richville | 84.5% | 17.9%(+66.6)#17 | 4.2%(+80.3)#238 |
| 18. | Bedford | 84.4% | 17.9%(+66.5)#18 | 4.2%(+80.2)#239 |
| 19. | Scotts Corners | 84.4% | 17.9%(+66.5)#19 | 4.2%(+80.2)#240 |
| 20. | Westport | 84.3% | 17.9%(+66.4)#20 | 4.2%(+80.1)#244 |
| 21. | Hurley | 83.7% | 17.9%(+65.8)#21 | 4.2%(+79.5)#256 |
| 22. | Verplanck | 83.5% | 17.9%(+65.6)#22 | 4.2%(+79.3)#258 |
| 23. | Claverack Red Mills | 83.1% | 17.9%(+65.2)#23 | 4.2%(+78.9)#264 |
| 24. | Sound Beach | 82.4% | 17.9%(+64.5)#24 | 4.2%(+78.2)#275 |
| 25. | Cementon | 82.4% | 17.9%(+64.5)#25 | 4.2%(+78.2)#279 |
| 26. | Lloyd Harbor | 82.3% | 17.9%(+64.4)#26 | 4.2%(+78.1)#282 |
| 27. | Rhinecliff | 82.2% | 17.9%(+64.3)#27 | 4.2%(+78.0)#284 |
| 28. | Hortonville | 82.1% | 17.9%(+64.2)#28 | 4.2%(+77.9)#287 |
| 29. | Nelsonville | 81.7% | 17.9%(+63.8)#29 | 4.2%(+77.5)#291 |
| 30. | Tuxedo Park | 81.0% | 17.9%(+63.1)#30 | 4.2%(+76.8)#308 |
| 31. | Shirley | 80.7% | 17.9%(+62.8)#31 | 4.2%(+76.5)#312 |
| 32. | Salisbury Mills | 80.5% | 17.9%(+62.6)#32 | 4.2%(+76.3)#318 |
| 33. | Shenorock | 79.9% | 17.9%(+62.0)#33 | 4.2%(+75.7)#326 |
| 34. | Plessis | 79.8% | 17.9%(+61.9)#34 | 4.2%(+75.6)#331 |
| 35. | Quogue | 78.7% | 17.9%(+60.8)#35 | 4.2%(+74.5)#349 |
| 36. | Staatsburg | 78.7% | 17.9%(+60.8)#36 | 4.2%(+74.5)#350 |
| 37. | Accord | 78.4% | 17.9%(+60.5)#37 | 4.2%(+74.2)#357 |
| 38. | Rocky Point | 77.5% | 17.9%(+59.6)#38 | 4.2%(+73.3)#381 |
| 39. | Salem | 77.5% | 17.9%(+59.6)#39 | 4.2%(+73.3)#384 |
| 40. | West Chazy | 77.0% | 17.9%(+59.1)#40 | 4.2%(+72.8)#394 |
| 41. | Garrattsville | 76.6% | 17.9%(+58.7)#41 | 4.2%(+72.4)#407 |
| 42. | Rifton | 76.4% | 17.9%(+58.5)#42 | 4.2%(+72.2)#411 |
| 43. | Kauneonga Lake | 76.2% | 17.9%(+58.3)#43 | 4.2%(+72.0)#416 |
| 44. | Schenevus | 76.1% | 17.9%(+58.2)#44 | 4.2%(+71.9)#421 |
| 45. | Upper Red Hook | 76.1% | 17.9%(+58.2)#45 | 4.2%(+71.9)#422 |
| 46. | Laurel Hollow | 75.9% | 17.9%(+58.0)#46 | 4.2%(+71.7)#425 |
| 47. | Levittown | 75.8% | 17.9%(+57.9)#47 | 4.2%(+71.6)#428 |
| 48. | Napanoch | 75.8% | 17.9%(+57.9)#48 | 4.2%(+71.6)#429 |
| 49. | Gardnertown | 75.6% | 17.9%(+57.7)#49 | 4.2%(+71.4)#433 |
| 50. | Barryville | 75.6% | 17.9%(+57.7)#50 | 4.2%(+71.4)#434 |
| 51. | Smyrna | 75.3% | 17.9%(+57.4)#51 | 4.2%(+71.1)#446 |
| 52. | Chazy | 75.2% | 17.9%(+57.3)#52 | 4.2%(+71.0)#447 |
| 53. | Remsenburg Speonk | 74.9% | 17.9%(+57.0)#53 | 4.2%(+70.7)#456 |
| 54. | Islandia | 74.2% | 17.9%(+56.3)#54 | 4.2%(+70.0)#475 |
| 55. | Yorktown Heights | 74.2% | 17.9%(+56.3)#55 | 4.2%(+70.0)#476 |
| 56. | Nichols | 74.2% | 17.9%(+56.3)#56 | 4.2%(+70.0)#477 |
| 57. | Springfield Center | 74.2% | 17.9%(+56.3)#57 | 4.2%(+70.0)#478 |
| 58. | Altona | 74.1% | 17.9%(+56.2)#58 | 4.2%(+69.9)#481 |
| 59. | Redford | 74.1% | 17.9%(+56.2)#59 | 4.2%(+69.9)#482 |
| 60. | Broadalbin | 74.0% | 17.9%(+56.1)#60 | 4.2%(+69.8)#483 |
| 61. | Centre Island | 73.8% | 17.9%(+55.9)#61 | 4.2%(+69.6)#488 |
| 62. | Willsboro | 73.6% | 17.9%(+55.7)#62 | 4.2%(+69.4)#493 |
| 63. | East Worcester | 73.6% | 17.9%(+55.7)#63 | 4.2%(+69.4)#494 |
| 64. | North Patchogue | 73.4% | 17.9%(+55.5)#64 | 4.2%(+69.2)#498 |
| 65. | Copake | 73.4% | 17.9%(+55.5)#65 | 4.2%(+69.2)#500 |
| 66. | Center Moriches | 73.3% | 17.9%(+55.4)#66 | 4.2%(+69.1)#503 |
| 67. | Malverne Park Oaks | 73.3% | 17.9%(+55.4)#67 | 4.2%(+69.1)#509 |
| 68. | Pine Hill | 73.1% | 17.9%(+55.2)#68 | 4.2%(+68.9)#518 |
| 69. | Farmingville | 72.9% | 17.9%(+55.0)#69 | 4.2%(+68.7)#522 |
| 70. | New Baltimore | 72.9% | 17.9%(+55.0)#70 | 4.2%(+68.7)#524 |
| 71. | Schaghticoke | 72.8% | 17.9%(+54.9)#71 | 4.2%(+68.6)#529 |
| 72. | Brookhaven | 72.7% | 17.9%(+54.8)#72 | 4.2%(+68.5)#533 |
| 73. | Round Top | 72.7% | 17.9%(+54.8)#73 | 4.2%(+68.5)#534 |
| 74. | Narrowsburg | 72.6% | 17.9%(+54.7)#74 | 4.2%(+68.4)#539 |
| 75. | East Shoreham | 72.5% | 17.9%(+54.6)#75 | 4.2%(+68.3)#541 |
| 76. | Greenport | 72.5% | 17.9%(+54.6)#76 | 4.2%(+68.3)#542 |
| 77. | Putnam Lake | 72.4% | 17.9%(+54.5)#77 | 4.2%(+68.2)#543 |
| 78. | Poland | 72.4% | 17.9%(+54.5)#78 | 4.2%(+68.2)#544 |
| 79. | Pine Plains | 71.9% | 17.9%(+54.0)#79 | 4.2%(+67.7)#559 |
| 80. | Ames | 71.4% | 17.9%(+53.5)#80 | 4.2%(+67.2)#572 |
| 81. | Wassaic | 71.3% | 17.9%(+53.4)#81 | 4.2%(+67.1)#578 |
| 82. | Redwood | 71.2% | 17.9%(+53.3)#82 | 4.2%(+67.0)#580 |
| 83. | Greenville Cdp Greene County | 71.1% | 17.9%(+53.2)#83 | 4.2%(+66.9)#583 |
| 84. | Wading River | 71.0% | 17.9%(+53.1)#84 | 4.2%(+66.8)#585 |
| 85. | West Hurley | 71.0% | 17.9%(+53.1)#85 | 4.2%(+66.8)#586 |
| 86. | Nissequogue | 71.0% | 17.9%(+53.1)#86 | 4.2%(+66.8)#587 |
| 87. | Bard College | 71.0% | 17.9%(+53.1)#87 | 4.2%(+66.8)#588 |
| 88. | Laurel | 70.9% | 17.9%(+53.0)#88 | 4.2%(+66.7)#592 |
| 89. | Palenville | 70.6% | 17.9%(+52.7)#89 | 4.2%(+66.4)#601 |
| 90. | Shelter Island Heights | 70.1% | 17.9%(+52.2)#90 | 4.2%(+65.9)#621 |
| 91. | Whitehall | 70.0% | 17.9%(+52.1)#91 | 4.2%(+65.8)#622 |
| 92. | Napeague | 70.0% | 17.9%(+52.1)#92 | 4.2%(+65.8)#627 |
| 93. | Poquott | 69.6% | 17.9%(+51.7)#93 | 4.2%(+65.4)#641 |
| 94. | Cold Spring | 69.5% | 17.9%(+51.6)#94 | 4.2%(+65.3)#643 |
| 95. | Rosendale | 69.4% | 17.9%(+51.5)#95 | 4.2%(+65.2)#648 |
| 96. | Downsville | 69.4% | 17.9%(+51.5)#96 | 4.2%(+65.2)#650 |
| 97. | Cove Neck | 69.3% | 17.9%(+51.4)#97 | 4.2%(+65.1)#654 |
| 98. | Salt Point | 69.2% | 17.9%(+51.3)#98 | 4.2%(+65.0)#661 |
| 99. | Aquebogue | 68.9% | 17.9%(+51.0)#99 | 4.2%(+64.7)#669 |
| 100. | Westernville | 68.9% | 17.9%(+51.0)#100 | 4.2%(+64.7)#671 |
Common Questions
What are the Top 10 Cities with the Highest Percentage of Households Heated by Fuel Oil / Kerosene in New York?
Top 10 Cities with the Highest Percentage of Households Heated by Fuel Oil / Kerosene in New York are:
#1
100.0%
#2
92.5%
#3
92.0%
#4
91.9%
#5
88.1%
#6
87.8%
#7
86.9%
#8
86.7%
#9
86.6%
#10
85.2%
What city has the Highest Percentage of Households Heated by Fuel Oil / Kerosene in New York?
Natural Bridge has the Highest Percentage of Households Heated by Fuel Oil / Kerosene in New York with 100.0%.
What is the Percentage of Households Heated by Fuel Oil / Kerosene in the State of New York?
Percentage of Households Heated by Fuel Oil / Kerosene in New York is 17.9%.
What is the Percentage of Households Heated by Fuel Oil / Kerosene in the United States?
Percentage of Households Heated by Fuel Oil / Kerosene in the United States is 4.2%.