Cities with the Highest Percentage of Households Heated by Fuel Oil / Kerosene in Montana
RELATED REPORTS & OPTIONS
Fuel Oil Heating
Montana
Compare Cities
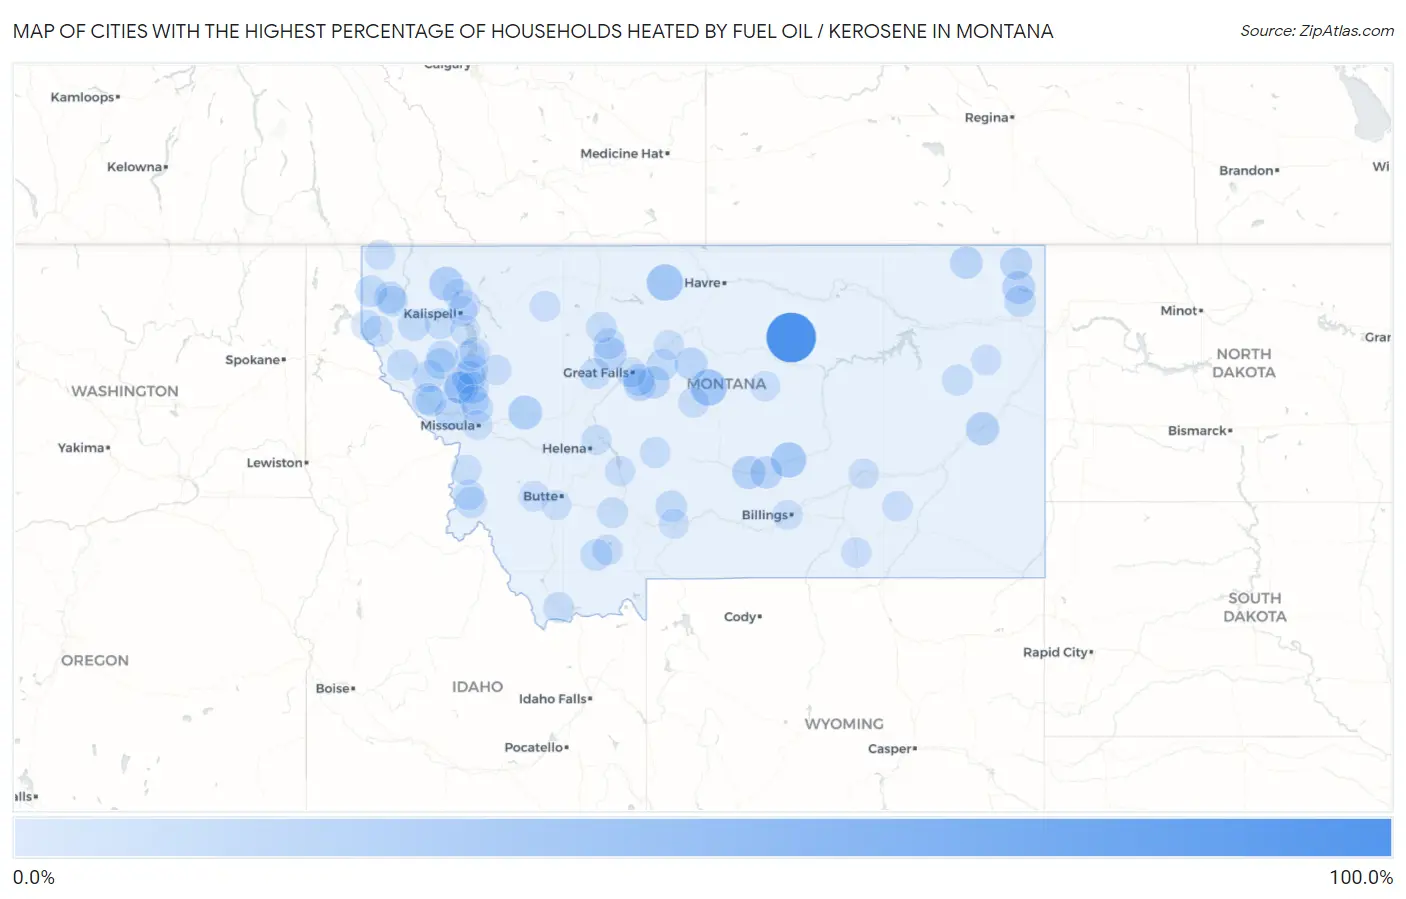
Map of Cities with the Highest Percentage of Households Heated by Fuel Oil / Kerosene in Montana
0.0%
100.0%
Cities with the Highest Percentage of Households Heated by Fuel Oil / Kerosene in Montana
| City | Fuel Oil Heating | vs State | vs National | |
| 1. | Zortman | 100.0% | 0.70%(+99.3)#1 | 4.2%(+95.8)#87 |
| 2. | Vida | 69.2% | 0.70%(+68.5)#2 | 4.2%(+65.0)#662 |
| 3. | Brockway | 50.0% | 0.70%(+49.3)#3 | 4.2%(+45.8)#1,572 |
| 4. | Floweree | 40.0% | 0.70%(+39.3)#4 | 4.2%(+35.8)#2,019 |
| 5. | Inverness | 30.8% | 0.70%(+30.1)#5 | 4.2%(+26.6)#2,507 |
| 6. | Denton | 30.4% | 0.70%(+29.7)#6 | 4.2%(+26.2)#2,527 |
| 7. | Roundup | 24.7% | 0.70%(+24.0)#7 | 4.2%(+20.5)#2,925 |
| 8. | Coffee Creek | 20.0% | 0.70%(+19.3)#8 | 4.2%(+15.8)#3,346 |
| 9. | Olney | 19.6% | 0.70%(+18.9)#9 | 4.2%(+15.4)#3,381 |
| 10. | Ovando | 18.5% | 0.70%(+17.8)#10 | 4.2%(+14.3)#3,498 |
| 11. | Helmville | 18.2% | 0.70%(+17.5)#11 | 4.2%(+14.0)#3,530 |
| 12. | Ryegate | 15.8% | 0.70%(+15.1)#12 | 4.2%(+11.6)#3,812 |
| 13. | Charlo | 15.6% | 0.70%(+14.9)#13 | 4.2%(+11.4)#3,843 |
| 14. | Fallon | 15.0% | 0.70%(+14.3)#14 | 4.2%(+10.8)#3,913 |
| 15. | Old Agency | 15.0% | 0.70%(+14.3)#15 | 4.2%(+10.8)#3,916 |
| 16. | Power | 13.2% | 0.70%(+12.5)#16 | 4.2%(+9.00)#4,160 |
| 17. | Medicine Lake | 12.9% | 0.70%(+12.2)#17 | 4.2%(+8.70)#4,194 |
| 18. | Scobey | 11.8% | 0.70%(+11.1)#18 | 4.2%(+7.60)#4,381 |
| 19. | Geraldine | 11.4% | 0.70%(+10.7)#19 | 4.2%(+7.20)#4,456 |
| 20. | Moccasin | 11.1% | 0.70%(+10.4)#20 | 4.2%(+6.90)#4,520 |
| 21. | Belt | 10.8% | 0.70%(+10.1)#21 | 4.2%(+6.60)#4,569 |
| 22. | Unionville | 10.5% | 0.70%(+9.80)#22 | 4.2%(+6.30)#4,609 |
| 23. | Lavina | 10.5% | 0.70%(+9.80)#23 | 4.2%(+6.30)#4,612 |
| 24. | Norris | 10.5% | 0.70%(+9.80)#24 | 4.2%(+6.30)#4,614 |
| 25. | St Ignatius | 10.4% | 0.70%(+9.70)#25 | 4.2%(+6.20)#4,626 |
| 26. | Alberton | 9.6% | 0.70%(+8.90)#26 | 4.2%(+5.40)#4,797 |
| 27. | Plentywood | 9.5% | 0.70%(+8.80)#27 | 4.2%(+5.30)#4,812 |
| 28. | Stockett | 9.4% | 0.70%(+8.70)#28 | 4.2%(+5.20)#4,855 |
| 29. | Libby | 8.2% | 0.70%(+7.50)#29 | 4.2%(+4.00)#5,136 |
| 30. | Plains | 8.2% | 0.70%(+7.50)#30 | 4.2%(+4.00)#5,140 |
| 31. | Sand Coulee | 7.6% | 0.70%(+6.90)#31 | 4.2%(+3.40)#5,298 |
| 32. | Clyde Park | 7.5% | 0.70%(+6.80)#32 | 4.2%(+3.30)#5,323 |
| 33. | Happys Inn | 7.4% | 0.70%(+6.70)#33 | 4.2%(+3.20)#5,357 |
| 34. | Virginia City | 7.1% | 0.70%(+6.40)#34 | 4.2%(+2.90)#5,442 |
| 35. | Highwood | 6.8% | 0.70%(+6.10)#35 | 4.2%(+2.60)#5,537 |
| 36. | Lonepine | 6.8% | 0.70%(+6.10)#36 | 4.2%(+2.60)#5,540 |
| 37. | Troy | 6.6% | 0.70%(+5.90)#37 | 4.2%(+2.40)#5,597 |
| 38. | Evaro | 6.4% | 0.70%(+5.70)#38 | 4.2%(+2.20)#5,666 |
| 39. | Dixon | 6.2% | 0.70%(+5.50)#39 | 4.2%(+2.00)#5,740 |
| 40. | Hot Springs | 6.1% | 0.70%(+5.40)#40 | 4.2%(+1.90)#5,769 |
| 41. | Froid | 6.1% | 0.70%(+5.40)#41 | 4.2%(+1.90)#5,776 |
| 42. | Superior | 6.0% | 0.70%(+5.30)#42 | 4.2%(+1.80)#5,811 |
| 43. | Conner | 6.0% | 0.70%(+5.30)#43 | 4.2%(+1.80)#5,825 |
| 44. | Ronan | 5.1% | 0.70%(+4.40)#44 | 4.2%(+0.900)#6,127 |
| 45. | Thompson Falls | 5.1% | 0.70%(+4.40)#45 | 4.2%(+0.900)#6,129 |
| 46. | Dutton | 5.0% | 0.70%(+4.30)#46 | 4.2%(+0.800)#6,195 |
| 47. | Twin Creeks | 5.0% | 0.70%(+4.30)#47 | 4.2%(+0.800)#6,199 |
| 48. | Simms | 4.8% | 0.70%(+4.10)#48 | 4.2%(+0.600)#6,281 |
| 49. | Noxon | 4.7% | 0.70%(+4.00)#49 | 4.2%(+0.500)#6,342 |
| 50. | Riverbend | 4.3% | 0.70%(+3.60)#50 | 4.2%(+0.100)#6,508 |
| 51. | Marion | 4.2% | 0.70%(+3.50)#51 | 4.2%(=0.000)#6,552 |
| 52. | Willow Creek | 4.1% | 0.70%(+3.40)#52 | 4.2%(-0.100)#6,635 |
| 53. | Brady | 4.0% | 0.70%(+3.30)#53 | 4.2%(-0.200)#6,705 |
| 54. | White Sulphur Springs | 3.9% | 0.70%(+3.20)#54 | 4.2%(-0.300)#6,734 |
| 55. | White Haven | 3.7% | 0.70%(+3.00)#55 | 4.2%(-0.500)#6,845 |
| 56. | Circle | 3.6% | 0.70%(+2.90)#56 | 4.2%(-0.600)#6,899 |
| 57. | Tracy | 3.6% | 0.70%(+2.90)#57 | 4.2%(-0.600)#6,918 |
| 58. | Lima | 3.4% | 0.70%(+2.70)#58 | 4.2%(-0.800)#7,020 |
| 59. | Stanford | 3.2% | 0.70%(+2.50)#59 | 4.2%(-1.00)#7,148 |
| 60. | Darby | 3.0% | 0.70%(+2.30)#60 | 4.2%(-1.20)#7,290 |
| 61. | Ennis | 2.9% | 0.70%(+2.20)#61 | 4.2%(-1.30)#7,361 |
| 62. | Heart Butte | 2.4% | 0.70%(+1.70)#62 | 4.2%(-1.80)#7,752 |
| 63. | Polson | 2.3% | 0.70%(+1.60)#63 | 4.2%(-1.90)#7,808 |
| 64. | Condon | 2.2% | 0.70%(+1.50)#64 | 4.2%(-2.00)#7,960 |
| 65. | Helena Flats | 2.1% | 0.70%(+1.40)#65 | 4.2%(-2.10)#8,028 |
| 66. | Arlee | 2.0% | 0.70%(+1.30)#66 | 4.2%(-2.20)#8,135 |
| 67. | Heron | 2.0% | 0.70%(+1.30)#67 | 4.2%(-2.20)#8,156 |
| 68. | Finley Point | 1.9% | 0.70%(+1.20)#68 | 4.2%(-2.30)#8,269 |
| 69. | Richey | 1.7% | 0.70%(+1.00)#69 | 4.2%(-2.50)#8,490 |
| 70. | Hysham | 1.7% | 0.70%(+1.00)#70 | 4.2%(-2.50)#8,493 |
| 71. | Colstrip | 1.5% | 0.70%(+0.800)#71 | 4.2%(-2.70)#8,680 |
| 72. | Anaconda Deer Lodge County | 1.4% | 0.70%(+0.700)#72 | 4.2%(-2.80)#8,770 |
| 73. | Yaak | 1.4% | 0.70%(+0.700)#73 | 4.2%(-2.80)#8,865 |
| 74. | Roy | 1.3% | 0.70%(+0.600)#74 | 4.2%(-2.90)#9,022 |
| 75. | Helena Valley Northeast | 1.2% | 0.70%(+0.500)#75 | 4.2%(-3.00)#9,076 |
| 76. | Townsend | 1.2% | 0.70%(+0.500)#76 | 4.2%(-3.00)#9,110 |
| 77. | Lodge Grass | 1.1% | 0.70%(+0.400)#77 | 4.2%(-3.10)#9,307 |
| 78. | Pinesdale | 1.0% | 0.70%(+0.300)#78 | 4.2%(-3.20)#9,462 |
| 79. | Evergreen | 0.70% | 0.70%(=0.000)#79 | 4.2%(-3.50)#9,996 |
| 80. | Whitefish | 0.70% | 0.70%(=0.000)#80 | 4.2%(-3.50)#10,002 |
| 81. | Butte Silver Bow Balance | 0.50% | 0.70%(-0.200)#81 | 4.2%(-3.70)#10,492 |
| 82. | Livingston | 0.50% | 0.70%(-0.200)#82 | 4.2%(-3.70)#10,565 |
| 83. | Fort Benton | 0.50% | 0.70%(-0.200)#83 | 4.2%(-3.70)#10,686 |
| 84. | Billings | 0.10% | 0.70%(-0.600)#84 | 4.2%(-4.10)#11,751 |
| 85. | Missoula | 0.10% | 0.70%(-0.600)#85 | 4.2%(-4.10)#11,817 |
| 86. | Great Falls | 0.10% | 0.70%(-0.600)#86 | 4.2%(-4.10)#11,856 |
| 87. | Lakeside | 0.10% | 0.70%(-0.600)#87 | 4.2%(-4.10)#12,175 |
Common Questions
What are the Top 10 Cities with the Highest Percentage of Households Heated by Fuel Oil / Kerosene in Montana?
Top 10 Cities with the Highest Percentage of Households Heated by Fuel Oil / Kerosene in Montana are:
What city has the Highest Percentage of Households Heated by Fuel Oil / Kerosene in Montana?
Zortman has the Highest Percentage of Households Heated by Fuel Oil / Kerosene in Montana with 100.0%.
What is the Percentage of Households Heated by Fuel Oil / Kerosene in the State of Montana?
Percentage of Households Heated by Fuel Oil / Kerosene in Montana is 0.70%.
What is the Percentage of Households Heated by Fuel Oil / Kerosene in the United States?
Percentage of Households Heated by Fuel Oil / Kerosene in the United States is 4.2%.