Cities with the Highest Percentage of Households Heated by Fuel Oil / Kerosene in Georgia
RELATED REPORTS & OPTIONS
Fuel Oil Heating
Georgia
Compare Cities
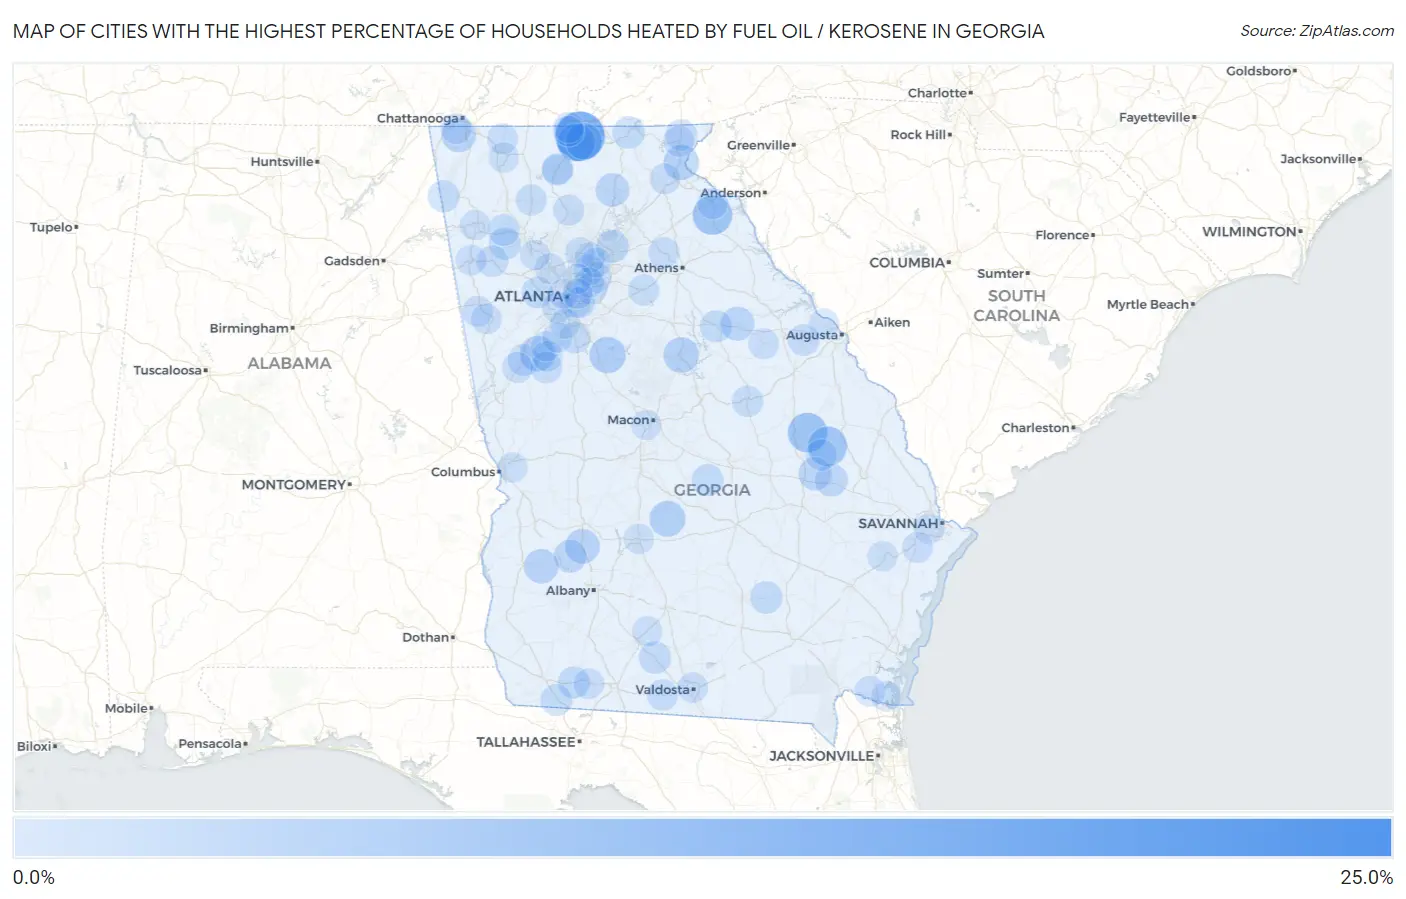
Map of Cities with the Highest Percentage of Households Heated by Fuel Oil / Kerosene in Georgia
0.0%
25.0%
Cities with the Highest Percentage of Households Heated by Fuel Oil / Kerosene in Georgia
| City | Fuel Oil Heating | vs State | vs National | |
| 1. | New England | 22.0% | 0.20%(+21.8)#1 | 4.2%(+17.8)#3,159 |
| 2. | Mineral Bluff | 14.5% | 0.20%(+14.3)#2 | 4.2%(+10.3)#3,985 |
| 3. | Canon | 6.9% | 0.20%(+6.70)#3 | 4.2%(+2.70)#5,489 |
| 4. | Summertown | 6.9% | 0.20%(+6.70)#4 | 4.2%(+2.70)#5,503 |
| 5. | Garfield | 6.8% | 0.20%(+6.60)#5 | 4.2%(+2.60)#5,536 |
| 6. | Blue Ridge | 5.7% | 0.20%(+5.50)#6 | 4.2%(+1.50)#5,901 |
| 7. | Jenkinsburg | 4.5% | 0.20%(+4.30)#7 | 4.2%(+0.300)#6,417 |
| 8. | Morganton | 4.5% | 0.20%(+4.30)#8 | 4.2%(+0.300)#6,418 |
| 9. | Pineview | 4.1% | 0.20%(+3.90)#9 | 4.2%(-0.100)#6,618 |
| 10. | Eatonton | 3.9% | 0.20%(+3.70)#10 | 4.2%(-0.300)#6,717 |
| 11. | Tallulah Falls | 3.8% | 0.20%(+3.60)#11 | 4.2%(-0.400)#6,796 |
| 12. | Sharpsburg | 3.7% | 0.20%(+3.50)#12 | 4.2%(-0.500)#6,856 |
| 13. | Shellman | 3.2% | 0.20%(+3.00)#13 | 4.2%(-1.00)#7,135 |
| 14. | Smithville | 3.2% | 0.20%(+3.00)#14 | 4.2%(-1.00)#7,146 |
| 15. | Chattanooga Valley | 3.1% | 0.20%(+2.90)#15 | 4.2%(-1.10)#7,171 |
| 16. | Crawfordville | 2.8% | 0.20%(+2.60)#16 | 4.2%(-1.40)#7,449 |
| 17. | Dahlonega | 2.5% | 0.20%(+2.30)#17 | 4.2%(-1.70)#7,644 |
| 18. | Stillmore | 2.2% | 0.20%(+2.00)#18 | 4.2%(-2.00)#7,945 |
| 19. | Metter | 2.0% | 0.20%(+1.80)#19 | 4.2%(-2.20)#8,103 |
| 20. | Bronwood | 2.0% | 0.20%(+1.80)#20 | 4.2%(-2.20)#8,154 |
| 21. | Buford | 1.9% | 0.20%(+1.70)#21 | 4.2%(-2.30)#8,183 |
| 22. | Georgetown Quitman County Unified Government | 1.7% | 0.20%(+1.50)#22 | 4.2%(-2.50)#8,438 |
| 23. | Young Harris | 1.6% | 0.20%(+1.40)#23 | 4.2%(-2.60)#8,564 |
| 24. | Berlin | 1.6% | 0.20%(+1.40)#24 | 4.2%(-2.60)#8,572 |
| 25. | Euharlee | 1.5% | 0.20%(+1.30)#25 | 4.2%(-2.70)#8,661 |
| 26. | Nicholls | 1.5% | 0.20%(+1.30)#26 | 4.2%(-2.70)#8,668 |
| 27. | Whigham | 1.4% | 0.20%(+1.20)#27 | 4.2%(-2.80)#8,851 |
| 28. | Siloam | 1.4% | 0.20%(+1.20)#28 | 4.2%(-2.80)#8,862 |
| 29. | Chester | 1.3% | 0.20%(+1.10)#29 | 4.2%(-2.90)#8,949 |
| 30. | Menlo | 1.3% | 0.20%(+1.10)#30 | 4.2%(-2.90)#8,997 |
| 31. | Lithia Springs | 1.1% | 0.20%(+0.900)#31 | 4.2%(-3.10)#9,190 |
| 32. | Kingston | 1.1% | 0.20%(+0.900)#32 | 4.2%(-3.10)#9,285 |
| 33. | Attapulgus | 1.1% | 0.20%(+0.900)#33 | 4.2%(-3.10)#9,287 |
| 34. | Lovejoy | 1.0% | 0.20%(+0.800)#34 | 4.2%(-3.20)#9,359 |
| 35. | Rockmart | 1.0% | 0.20%(+0.800)#35 | 4.2%(-3.20)#9,390 |
| 36. | Harlem | 1.0% | 0.20%(+0.800)#36 | 4.2%(-3.20)#9,402 |
| 37. | Twin City | 1.0% | 0.20%(+0.800)#37 | 4.2%(-3.20)#9,437 |
| 38. | Mountain City | 1.0% | 0.20%(+0.800)#38 | 4.2%(-3.20)#9,459 |
| 39. | Moreland | 1.0% | 0.20%(+0.800)#39 | 4.2%(-3.20)#9,476 |
| 40. | Haralson | 1.0% | 0.20%(+0.800)#40 | 4.2%(-3.20)#9,498 |
| 41. | Stone Mountain | 0.90% | 0.20%(+0.700)#41 | 4.2%(-3.30)#9,566 |
| 42. | Sandersville | 0.90% | 0.20%(+0.700)#42 | 4.2%(-3.30)#9,573 |
| 43. | Quitman | 0.90% | 0.20%(+0.700)#43 | 4.2%(-3.30)#9,586 |
| 44. | Arcade | 0.80% | 0.20%(+0.600)#44 | 4.2%(-3.40)#9,847 |
| 45. | Monroe | 0.70% | 0.20%(+0.500)#45 | 4.2%(-3.50)#9,970 |
| 46. | Gresham Park | 0.70% | 0.20%(+0.500)#46 | 4.2%(-3.50)#10,004 |
| 47. | Ellijay | 0.70% | 0.20%(+0.500)#47 | 4.2%(-3.50)#10,092 |
| 48. | Fairmount | 0.70% | 0.20%(+0.500)#48 | 4.2%(-3.50)#10,112 |
| 49. | Nelson | 0.70% | 0.20%(+0.500)#49 | 4.2%(-3.50)#10,128 |
| 50. | East Ellijay | 0.70% | 0.20%(+0.500)#50 | 4.2%(-3.50)#10,160 |
| 51. | Lilburn | 0.60% | 0.20%(+0.400)#51 | 4.2%(-3.60)#10,231 |
| 52. | Clayton | 0.60% | 0.20%(+0.400)#52 | 4.2%(-3.60)#10,357 |
| 53. | Marietta | 0.50% | 0.20%(+0.300)#53 | 4.2%(-3.70)#10,473 |
| 54. | Norcross | 0.50% | 0.20%(+0.300)#54 | 4.2%(-3.70)#10,513 |
| 55. | Cedartown | 0.50% | 0.20%(+0.300)#55 | 4.2%(-3.70)#10,547 |
| 56. | Cusseta Chattahoochee County Unified Government | 0.50% | 0.20%(+0.300)#56 | 4.2%(-3.70)#10,558 |
| 57. | Grantville | 0.50% | 0.20%(+0.300)#57 | 4.2%(-3.70)#10,623 |
| 58. | Varnell | 0.50% | 0.20%(+0.300)#58 | 4.2%(-3.70)#10,649 |
| 59. | Mount Zion | 0.50% | 0.20%(+0.300)#59 | 4.2%(-3.70)#10,651 |
| 60. | Clarkesville | 0.50% | 0.20%(+0.300)#60 | 4.2%(-3.70)#10,670 |
| 61. | East Point | 0.40% | 0.20%(+0.200)#61 | 4.2%(-3.80)#10,796 |
| 62. | Carrollton | 0.40% | 0.20%(+0.200)#62 | 4.2%(-3.80)#10,812 |
| 63. | Kingsland | 0.40% | 0.20%(+0.200)#63 | 4.2%(-3.80)#10,837 |
| 64. | Richmond Hill | 0.40% | 0.20%(+0.200)#64 | 4.2%(-3.80)#10,845 |
| 65. | Senoia | 0.40% | 0.20%(+0.200)#65 | 4.2%(-3.80)#10,915 |
| 66. | Lavonia | 0.40% | 0.20%(+0.200)#66 | 4.2%(-3.80)#10,939 |
| 67. | Warrenton | 0.40% | 0.20%(+0.200)#67 | 4.2%(-3.80)#10,966 |
| 68. | Mccaysville | 0.40% | 0.20%(+0.200)#68 | 4.2%(-3.80)#10,979 |
| 69. | Johns Creek | 0.30% | 0.20%(+0.100)#69 | 4.2%(-3.90)#11,046 |
| 70. | Valdosta | 0.30% | 0.20%(+0.100)#70 | 4.2%(-3.90)#11,062 |
| 71. | Cairo | 0.30% | 0.20%(+0.100)#71 | 4.2%(-3.90)#11,185 |
| 72. | Panthersville | 0.30% | 0.20%(+0.100)#72 | 4.2%(-3.90)#11,189 |
| 73. | Webster County Unified Government | 0.30% | 0.20%(+0.100)#73 | 4.2%(-3.90)#11,265 |
| 74. | Lookout Mountain | 0.30% | 0.20%(+0.100)#74 | 4.2%(-3.90)#11,279 |
| 75. | Epworth | 0.30% | 0.20%(+0.100)#75 | 4.2%(-3.90)#11,316 |
| 76. | Augusta-Richmond County Consolidated Government (Balance) | 0.20% | 0.20%(=0.000)#76 | 4.2%(-4.00)#11,329 |
| 77. | Athens-Clarke County Unified Government (Balance) | 0.20% | 0.20%(=0.000)#77 | 4.2%(-4.00)#11,336 |
| 78. | Rome | 0.20% | 0.20%(=0.000)#78 | 4.2%(-4.00)#11,413 |
| 79. | Evans | 0.20% | 0.20%(=0.000)#79 | 4.2%(-4.00)#11,414 |
| 80. | Dalton | 0.20% | 0.20%(=0.000)#80 | 4.2%(-4.00)#11,423 |
| 81. | Acworth | 0.20% | 0.20%(=0.000)#81 | 4.2%(-4.00)#11,477 |
| 82. | Cordele | 0.20% | 0.20%(=0.000)#82 | 4.2%(-4.00)#11,576 |
| 83. | Norman Park | 0.20% | 0.20%(=0.000)#83 | 4.2%(-4.00)#11,644 |
| 84. | Atlanta | 0.10% | 0.20%(-0.100)#84 | 4.2%(-4.10)#11,668 |
| 85. | Columbus | 0.10% | 0.20%(-0.100)#85 | 4.2%(-4.10)#11,700 |
| 86. | Macon Bibb County | 0.10% | 0.20%(-0.100)#86 | 4.2%(-4.10)#11,726 |
| 87. | Savannah | 0.10% | 0.20%(-0.100)#87 | 4.2%(-4.10)#11,731 |
| 88. | Alpharetta | 0.10% | 0.20%(-0.100)#88 | 4.2%(-4.10)#11,838 |
| 89. | Peachtree City | 0.10% | 0.20%(-0.100)#89 | 4.2%(-4.10)#11,929 |
| 90. | Tucker | 0.10% | 0.20%(-0.100)#90 | 4.2%(-4.10)#11,939 |
| 91. | Hinesville | 0.10% | 0.20%(-0.100)#91 | 4.2%(-4.10)#11,956 |
| 92. | Duluth | 0.10% | 0.20%(-0.100)#92 | 4.2%(-4.10)#11,981 |
| 93. | Chamblee | 0.10% | 0.20%(-0.100)#93 | 4.2%(-4.10)#11,989 |
| 94. | Decatur | 0.10% | 0.20%(-0.100)#94 | 4.2%(-4.10)#12,027 |
| 95. | Fayetteville | 0.10% | 0.20%(-0.100)#95 | 4.2%(-4.10)#12,078 |
| 96. | St Marys | 0.10% | 0.20%(-0.100)#96 | 4.2%(-4.10)#12,085 |
| 97. | Riverdale | 0.10% | 0.20%(-0.100)#97 | 4.2%(-4.10)#12,117 |
Common Questions
What are the Top 10 Cities with the Highest Percentage of Households Heated by Fuel Oil / Kerosene in Georgia?
Top 10 Cities with the Highest Percentage of Households Heated by Fuel Oil / Kerosene in Georgia are:
#1
14.5%
#2
6.9%
#3
6.9%
#4
6.8%
#5
5.7%
#6
4.5%
#7
4.5%
#8
4.1%
#9
3.9%
#10
3.8%
What city has the Highest Percentage of Households Heated by Fuel Oil / Kerosene in Georgia?
Mineral Bluff has the Highest Percentage of Households Heated by Fuel Oil / Kerosene in Georgia with 14.5%.
What is the Percentage of Households Heated by Fuel Oil / Kerosene in the State of Georgia?
Percentage of Households Heated by Fuel Oil / Kerosene in Georgia is 0.20%.
What is the Percentage of Households Heated by Fuel Oil / Kerosene in the United States?
Percentage of Households Heated by Fuel Oil / Kerosene in the United States is 4.2%.