Cities with the Highest Percentage of Households Heated by Fuel Oil / Kerosene in Minnesota
RELATED REPORTS & OPTIONS
Fuel Oil Heating
Minnesota
Compare Cities
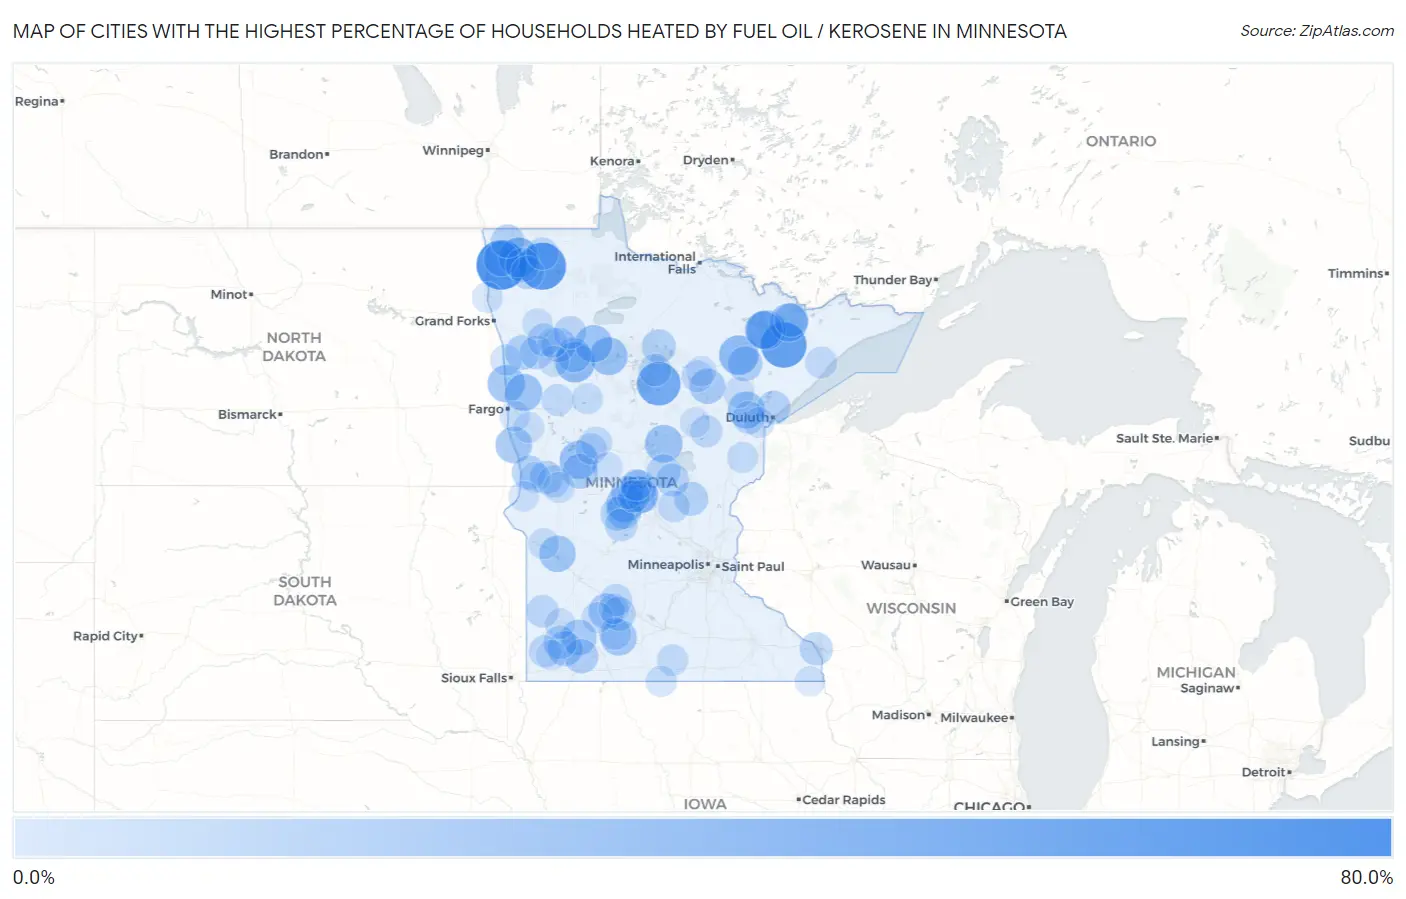
Map of Cities with the Highest Percentage of Households Heated by Fuel Oil / Kerosene in Minnesota
0.0%
80.0%
Cities with the Highest Percentage of Households Heated by Fuel Oil / Kerosene in Minnesota
| City | Fuel Oil Heating | vs State | vs National | |
| 1. | Donaldson | 66.7% | 1.4%(+65.3)#1 | 4.2%(+62.5)#759 |
| 2. | Strathcona | 60.0% | 1.4%(+58.6)#2 | 4.2%(+55.8)#1,059 |
| 3. | Babbitt | 55.8% | 1.4%(+54.4)#3 | 4.2%(+51.6)#1,261 |
| 4. | Boy River | 50.0% | 1.4%(+48.6)#4 | 4.2%(+45.8)#1,574 |
| 5. | Halma | 40.0% | 1.4%(+38.6)#5 | 4.2%(+35.8)#2,016 |
| 6. | Pine Bend | 40.0% | 1.4%(+38.6)#6 | 4.2%(+35.8)#2,018 |
| 7. | Kinney | 38.7% | 1.4%(+37.3)#7 | 4.2%(+34.5)#2,087 |
| 8. | Soudan | 38.5% | 1.4%(+37.1)#8 | 4.2%(+34.3)#2,097 |
| 9. | Ely | 36.0% | 1.4%(+34.6)#9 | 4.2%(+31.8)#2,200 |
| 10. | Vining | 35.5% | 1.4%(+34.1)#10 | 4.2%(+31.3)#2,225 |
| 11. | Wilton | 34.2% | 1.4%(+32.8)#11 | 4.2%(+30.0)#2,291 |
| 12. | Tower | 33.9% | 1.4%(+32.5)#12 | 4.2%(+29.7)#2,316 |
| 13. | Riverton | 33.8% | 1.4%(+32.4)#13 | 4.2%(+29.6)#2,323 |
| 14. | Perley | 33.3% | 1.4%(+31.9)#14 | 4.2%(+29.1)#2,340 |
| 15. | St Rosa | 33.3% | 1.4%(+31.9)#15 | 4.2%(+29.1)#2,344 |
| 16. | Leonard | 33.3% | 1.4%(+31.9)#16 | 4.2%(+29.1)#2,349 |
| 17. | Elmdale | 32.8% | 1.4%(+31.4)#17 | 4.2%(+28.6)#2,374 |
| 18. | Felton | 32.4% | 1.4%(+31.0)#18 | 4.2%(+28.2)#2,396 |
| 19. | Brookston | 32.4% | 1.4%(+31.0)#19 | 4.2%(+28.2)#2,397 |
| 20. | Milan | 31.1% | 1.4%(+29.7)#20 | 4.2%(+26.9)#2,481 |
| 21. | Kent | 30.8% | 1.4%(+29.4)#21 | 4.2%(+26.6)#2,506 |
| 22. | Darfur | 30.0% | 1.4%(+28.6)#22 | 4.2%(+25.8)#2,561 |
| 23. | Clements | 28.6% | 1.4%(+27.2)#23 | 4.2%(+24.4)#2,644 |
| 24. | Dovray | 28.6% | 1.4%(+27.2)#24 | 4.2%(+24.4)#2,647 |
| 25. | Warba | 27.9% | 1.4%(+26.5)#25 | 4.2%(+23.7)#2,684 |
| 26. | Sobieski | 27.5% | 1.4%(+26.1)#26 | 4.2%(+23.3)#2,713 |
| 27. | Kennedy | 27.4% | 1.4%(+26.0)#27 | 4.2%(+23.2)#2,721 |
| 28. | Iona | 27.2% | 1.4%(+25.8)#28 | 4.2%(+23.0)#2,736 |
| 29. | New Munich | 26.9% | 1.4%(+25.5)#29 | 4.2%(+22.7)#2,761 |
| 30. | Iron Junction | 26.8% | 1.4%(+25.4)#30 | 4.2%(+22.6)#2,776 |
| 31. | Urbank | 26.7% | 1.4%(+25.3)#31 | 4.2%(+22.5)#2,784 |
| 32. | Lengby | 26.1% | 1.4%(+24.7)#32 | 4.2%(+21.9)#2,829 |
| 33. | Beltrami | 25.9% | 1.4%(+24.5)#33 | 4.2%(+21.7)#2,842 |
| 34. | Mcintosh | 25.0% | 1.4%(+23.6)#34 | 4.2%(+20.8)#2,898 |
| 35. | Kinbrae | 25.0% | 1.4%(+23.6)#35 | 4.2%(+20.8)#2,909 |
| 36. | Campbell | 24.4% | 1.4%(+23.0)#36 | 4.2%(+20.2)#2,957 |
| 37. | Squaw Lake | 24.2% | 1.4%(+22.8)#37 | 4.2%(+20.0)#2,971 |
| 38. | Greenwald | 24.1% | 1.4%(+22.7)#38 | 4.2%(+19.9)#2,977 |
| 39. | Evan | 24.1% | 1.4%(+22.7)#39 | 4.2%(+19.9)#2,978 |
| 40. | Karlstad | 24.0% | 1.4%(+22.6)#40 | 4.2%(+19.8)#2,985 |
| 41. | Bock | 24.0% | 1.4%(+22.6)#41 | 4.2%(+19.8)#2,992 |
| 42. | Harding | 23.9% | 1.4%(+22.5)#42 | 4.2%(+19.7)#3,003 |
| 43. | Winton | 23.6% | 1.4%(+22.2)#43 | 4.2%(+19.4)#3,028 |
| 44. | Rice Lake | 23.3% | 1.4%(+21.9)#44 | 4.2%(+19.1)#3,042 |
| 45. | Fertile | 23.3% | 1.4%(+21.9)#45 | 4.2%(+19.1)#3,048 |
| 46. | Lancaster | 23.2% | 1.4%(+21.8)#46 | 4.2%(+19.0)#3,057 |
| 47. | Hadley | 22.7% | 1.4%(+21.3)#47 | 4.2%(+18.5)#3,094 |
| 48. | Wendell | 22.6% | 1.4%(+21.2)#48 | 4.2%(+18.4)#3,099 |
| 49. | Burtrum | 22.4% | 1.4%(+21.0)#49 | 4.2%(+18.2)#3,118 |
| 50. | Hillman | 22.2% | 1.4%(+20.8)#50 | 4.2%(+18.0)#3,137 |
| 51. | Dakota | 22.0% | 1.4%(+20.6)#51 | 4.2%(+17.8)#3,161 |
| 52. | Bowlus | 22.0% | 1.4%(+20.6)#52 | 4.2%(+17.8)#3,162 |
| 53. | Strandquist | 22.0% | 1.4%(+20.6)#53 | 4.2%(+17.8)#3,166 |
| 54. | Mentor | 21.4% | 1.4%(+20.0)#54 | 4.2%(+17.2)#3,223 |
| 55. | Trail | 21.1% | 1.4%(+19.7)#55 | 4.2%(+16.9)#3,245 |
| 56. | Mahnomen | 21.0% | 1.4%(+19.6)#56 | 4.2%(+16.8)#3,251 |
| 57. | Bena | 20.6% | 1.4%(+19.2)#57 | 4.2%(+16.4)#3,286 |
| 58. | Lake Henry | 20.5% | 1.4%(+19.1)#58 | 4.2%(+16.3)#3,298 |
| 59. | Arco | 20.5% | 1.4%(+19.1)#59 | 4.2%(+16.3)#3,299 |
| 60. | Upsala | 20.2% | 1.4%(+18.8)#60 | 4.2%(+16.0)#3,326 |
| 61. | Greenbush | 20.1% | 1.4%(+18.7)#61 | 4.2%(+15.9)#3,333 |
| 62. | Mcgregor | 19.9% | 1.4%(+18.5)#62 | 4.2%(+15.7)#3,354 |
| 63. | Edgerton | 19.7% | 1.4%(+18.3)#63 | 4.2%(+15.5)#3,370 |
| 64. | Elbow Lake | 19.4% | 1.4%(+18.0)#64 | 4.2%(+15.2)#3,404 |
| 65. | Franklin | 19.3% | 1.4%(+17.9)#65 | 4.2%(+15.1)#3,417 |
| 66. | Comfrey | 19.3% | 1.4%(+17.9)#66 | 4.2%(+15.1)#3,420 |
| 67. | Knife River | 19.1% | 1.4%(+17.7)#67 | 4.2%(+14.9)#3,440 |
| 68. | Finland | 19.0% | 1.4%(+17.6)#68 | 4.2%(+14.8)#3,446 |
| 69. | Callaway | 18.8% | 1.4%(+17.4)#69 | 4.2%(+14.6)#3,461 |
| 70. | Ronneby | 18.8% | 1.4%(+17.4)#70 | 4.2%(+14.6)#3,462 |
| 71. | Bluffton | 18.6% | 1.4%(+17.2)#71 | 4.2%(+14.4)#3,477 |
| 72. | Coleraine | 18.4% | 1.4%(+17.0)#72 | 4.2%(+14.2)#3,502 |
| 73. | Deer Creek | 18.3% | 1.4%(+16.9)#73 | 4.2%(+14.1)#3,516 |
| 74. | Flensburg | 18.3% | 1.4%(+16.9)#74 | 4.2%(+14.1)#3,517 |
| 75. | Hubbard | 18.2% | 1.4%(+16.8)#75 | 4.2%(+14.0)#3,533 |
| 76. | Easton | 17.6% | 1.4%(+16.2)#76 | 4.2%(+13.4)#3,585 |
| 77. | Shelly | 17.5% | 1.4%(+16.1)#77 | 4.2%(+13.3)#3,597 |
| 78. | Wanda | 17.4% | 1.4%(+16.0)#78 | 4.2%(+13.2)#3,612 |
| 79. | Pine Point | 17.0% | 1.4%(+15.6)#79 | 4.2%(+12.8)#3,652 |
| 80. | Barrett | 16.9% | 1.4%(+15.5)#80 | 4.2%(+12.7)#3,659 |
| 81. | Elmore | 16.7% | 1.4%(+15.3)#81 | 4.2%(+12.5)#3,682 |
| 82. | Nashua | 16.7% | 1.4%(+15.3)#82 | 4.2%(+12.5)#3,692 |
| 83. | Bruno | 16.7% | 1.4%(+15.3)#83 | 4.2%(+12.5)#3,693 |
| 84. | Correll | 16.7% | 1.4%(+15.3)#84 | 4.2%(+12.5)#3,697 |
| 85. | Meadowlands | 16.3% | 1.4%(+14.9)#85 | 4.2%(+12.1)#3,746 |
| 86. | Bejou | 16.2% | 1.4%(+14.8)#86 | 4.2%(+12.0)#3,755 |
| 87. | Barnesville | 16.1% | 1.4%(+14.7)#87 | 4.2%(+11.9)#3,759 |
| 88. | Esko | 15.9% | 1.4%(+14.5)#88 | 4.2%(+11.7)#3,787 |
| 89. | Sabin | 15.9% | 1.4%(+14.5)#89 | 4.2%(+11.7)#3,794 |
| 90. | Oslo | 15.8% | 1.4%(+14.4)#90 | 4.2%(+11.6)#3,811 |
| 91. | Red Lake Falls | 15.7% | 1.4%(+14.3)#91 | 4.2%(+11.5)#3,821 |
| 92. | Balaton | 15.7% | 1.4%(+14.3)#92 | 4.2%(+11.5)#3,822 |
| 93. | Eagle Bend | 15.6% | 1.4%(+14.2)#93 | 4.2%(+11.4)#3,840 |
| 94. | Taconite | 15.4% | 1.4%(+14.0)#94 | 4.2%(+11.2)#3,860 |
| 95. | Wheaton | 15.3% | 1.4%(+13.9)#95 | 4.2%(+11.1)#3,868 |
| 96. | Morgan | 15.2% | 1.4%(+13.8)#96 | 4.2%(+11.0)#3,882 |
| 97. | Erskine | 14.7% | 1.4%(+13.3)#97 | 4.2%(+10.5)#3,952 |
| 98. | Leota | 14.5% | 1.4%(+13.1)#98 | 4.2%(+10.3)#3,986 |
| 99. | Palisade | 14.5% | 1.4%(+13.1)#99 | 4.2%(+10.3)#3,987 |
| 100. | Eitzen | 14.3% | 1.4%(+12.9)#100 | 4.2%(+10.1)#4,008 |
Common Questions
What are the Top 10 Cities with the Highest Percentage of Households Heated by Fuel Oil / Kerosene in Minnesota?
Top 10 Cities with the Highest Percentage of Households Heated by Fuel Oil / Kerosene in Minnesota are:
What city has the Highest Percentage of Households Heated by Fuel Oil / Kerosene in Minnesota?
Donaldson has the Highest Percentage of Households Heated by Fuel Oil / Kerosene in Minnesota with 66.7%.
What is the Percentage of Households Heated by Fuel Oil / Kerosene in the State of Minnesota?
Percentage of Households Heated by Fuel Oil / Kerosene in Minnesota is 1.4%.
What is the Percentage of Households Heated by Fuel Oil / Kerosene in the United States?
Percentage of Households Heated by Fuel Oil / Kerosene in the United States is 4.2%.