Cities with the Highest Percentage of Households Heated by Fuel Oil / Kerosene in Utah

RELATED REPORTS & OPTIONS

Fuel Oil Heating
Population
Families and Households
Female Fertility
Female Fertility (Unmarried)
Race (Community Size)
Race (Percentage)
Ancestry (Community Size)
AfghanAfricanAlaska NativeAlaskan AthabascanAlbanianAleutAlsatianAmericanApacheArabArapahoArgentineanArmenianAssyrian / Chaldean / SyriacAustralianAustrianBahamianBangladeshiBarbadianBasqueBelgianBelizeanBermudanBhutaneseBlackfeetBolivianBrazilianBritishBritish West IndianBulgarianBurmeseCajunCambodianCanadianCape VerdeanCarpatho RusynCelticCentral AmericanCentral American IndianCherokeeCheyenneChickasawChileanChineseChippewaChoctawColombianColvilleComancheCosta RicanCreeCreekCroatianCrowCubanCypriotCzechCzechoslovakianDanishDelawareDominicanDutchDutch West IndianEastern EuropeanEcuadorianEgyptianEnglishEstonianEthiopianEuropeanFijianFilipinoFinnishFrenchFrench American IndianFrench CanadianGermanGerman RussianGhanaianGreekGuamanian / ChamorroGuatemalanGuyaneseHaitianHmongHonduranHopiHoumaHungarianIcelanderIndian (Asian)IndonesianInupiatIranianIraqiIrishIroquoisIsraeliItalianJamaicanJapaneseJordanianKenyanKiowaKoreanLaotianLatvianLebaneseLiberianLithuanianLumbeeLuxembourgerMacedonianMalaysianMalteseMarshalleseMenomineeMexicanMexican American IndianMongolianMoroccanNative HawaiianNavajoNepaleseNew ZealanderNicaraguanNigerianNorthern EuropeanNorwegianOkinawanOsageOttawaPaiutePakistaniPalestinianPanamanianParaguayanPennsylvania GermanPeruvianPimaPolishPortuguesePotawatomiPuebloPuerto RicanPuget Sound SalishRomanianRussianSalvadoranSamoanScandinavianScotch-IrishScottishSeminoleSenegaleseSerbianShoshoneSierra LeoneanSiouxSlavicSlovakSloveneSomaliSouth AfricanSouth AmericanSouth American IndianSoviet UnionSpaniardSpanishSpanish AmericanSpanish American IndianSri LankanSubsaharan AfricanSudaneseSwedishSwissSyrianTaiwaneseThaiTlingit-HaidaTohono O'OdhamTonganTrinidadian and TobagonianTsimshianTurkishU.S. Virgin IslanderUgandanUkrainianUruguayanUteVenezuelanVietnameseWelshWest IndianYakamaYaquiYugoslavianYumanYup'ikZimbabwean
Ancestry (Percentage)
AfghanAfricanAlaska NativeAlaskan AthabascanAlbanianAleutAlsatianAmericanApacheArabArapahoArgentineanArmenianAssyrian / Chaldean / SyriacAustralianAustrianBahamianBangladeshiBarbadianBasqueBelgianBelizeanBermudanBhutaneseBlackfeetBolivianBrazilianBritishBritish West IndianBulgarianBurmeseCajunCambodianCanadianCape VerdeanCarpatho RusynCelticCentral AmericanCentral American IndianCherokeeCheyenneChickasawChileanChineseChippewaChoctawColombianColvilleComancheCosta RicanCreeCreekCroatianCrowCubanCypriotCzechCzechoslovakianDanishDelawareDominicanDutchDutch West IndianEastern EuropeanEcuadorianEgyptianEnglishEstonianEthiopianEuropeanFijianFilipinoFinnishFrenchFrench American IndianFrench CanadianGermanGerman RussianGhanaianGreekGuamanian / ChamorroGuatemalanGuyaneseHaitianHmongHonduranHopiHoumaHungarianIcelanderIndian (Asian)IndonesianInupiatIranianIraqiIrishIroquoisIsraeliItalianJamaicanJapaneseJordanianKenyanKiowaKoreanLaotianLatvianLebaneseLiberianLithuanianLumbeeLuxembourgerMacedonianMalaysianMalteseMarshalleseMenomineeMexicanMexican American IndianMongolianMoroccanNative HawaiianNavajoNepaleseNew ZealanderNicaraguanNigerianNorthern EuropeanNorwegianOkinawanOsageOttawaPaiutePakistaniPalestinianPanamanianParaguayanPennsylvania GermanPeruvianPimaPolishPortuguesePotawatomiPuebloPuerto RicanPuget Sound SalishRomanianRussianSalvadoranSamoanScandinavianScotch-IrishScottishSeminoleSenegaleseSerbianShoshoneSierra LeoneanSiouxSlavicSlovakSloveneSomaliSouth AfricanSouth AmericanSouth American IndianSoviet UnionSpaniardSpanishSpanish AmericanSpanish American IndianSri LankanSubsaharan AfricanSudaneseSwedishSwissSyrianTaiwaneseThaiTlingit-HaidaTohono O'OdhamTonganTrinidadian and TobagonianTsimshianTurkishU.S. Virgin IslanderUgandanUkrainianUruguayanUteVenezuelanVietnameseWelshWest IndianYakamaYaquiYugoslavianYumanYup'ikZimbabwean
Immigrant Origin (Total)
AfghanistanAfricaAlbaniaArgentinaArmeniaAsiaAustraliaAustriaAzoresBahamasBangladeshBarbadosBelarusBelgiumBelizeBoliviaBosnia and HerzegovinaBrazilBulgariaBurma / MyanmarCabo VerdeCambodiaCameroonCanadaCaribbeanCentral AmericaChileChinaColombiaCongoCosta RicaCroatiaCubaCzechoslovakiaDenmarkDominicaDominican RepublicEastern AfricaEastern AsiaEastern EuropeEcuadorEgyptEl SalvadorEnglandEritreaEthiopiaEuropeFijiFranceGermanyGhanaGreeceGrenadaGuatemalaGuyanaHaitiHondurasHong KongHungaryIndiaIndonesiaIranIraqIrelandIsraelItalyJamaicaJapanJordanKazakhstanKenyaKoreaKuwaitLaosLatin AmericaLatviaLebanonLiberiaLithuaniaMalaysiaMexicoMicronesiaMiddle AfricaMoldovaMoroccoNepalNetherlandsNicaraguaNigeriaNorth MacedoniaNorthern AfricaNorthern EuropeNorwayOceaniaPakistanPanamaPeruPhilippinesPolandPortugalRomaniaRussiaSaudi ArabiaScotlandSenegalSerbiaSierra LeoneSingaporeSomaliaSouth AfricaSouth AmericaSouth Central AsiaSouth Eastern AsiaSouthern EuropeSpainSri LankaSt. Vincent and the GrenadinesSudanSwedenSwitzerlandSyriaTaiwanThailandTrinidad and TobagoTurkeyUgandaUkraineUruguayUzbekistanVenezuelaVietnamWest IndiesWestern AfricaWestern AsiaWestern EuropeYemenZaireZimbabwe
Immigrant Origin (Percentage)
AfghanistanAfricaAlbaniaArgentinaArmeniaAsiaAustraliaAustriaAzoresBahamasBangladeshBarbadosBelarusBelgiumBelizeBoliviaBosnia and HerzegovinaBrazilBulgariaBurma / MyanmarCabo VerdeCambodiaCameroonCanadaCaribbeanCentral AmericaChileChinaColombiaCongoCosta RicaCroatiaCubaCzechoslovakiaDenmarkDominicaDominican RepublicEastern AfricaEastern AsiaEastern EuropeEcuadorEgyptEl SalvadorEnglandEritreaEthiopiaEuropeFijiFranceGermanyGhanaGreeceGrenadaGuatemalaGuyanaHaitiHondurasHong KongHungaryIndiaIndonesiaIranIraqIrelandIsraelItalyJamaicaJapanJordanKazakhstanKenyaKoreaKuwaitLaosLatin AmericaLatviaLebanonLiberiaLithuaniaMalaysiaMexicoMicronesiaMiddle AfricaMoldovaMoroccoNepalNetherlandsNicaraguaNigeriaNorth MacedoniaNorthern AfricaNorthern EuropeNorwayOceaniaPakistanPanamaPeruPhilippinesPolandPortugalRomaniaRussiaSaudi ArabiaScotlandSenegalSerbiaSierra LeoneSingaporeSomaliaSouth AfricaSouth AmericaSouth Central AsiaSouth Eastern AsiaSouthern EuropeSpainSri LankaSt. Vincent and the GrenadinesSudanSwedenSwitzerlandSyriaTaiwanThailandTrinidad and TobagoTurkeyUgandaUkraineUruguayUzbekistanVenezuelaVietnamWest IndiesWestern AfricaWestern AsiaWestern EuropeYemenZaireZimbabwe
Income
Income (Families)
Income (Households)
Poverty
Poverty (Families)
Unemployment
Employment Occupations
Employment Industries
Employer Class
Commute Time
Commute Means
School Enrollment
Education by Degree Field
Occupancy
Finances
Physical Characteristics
Utah
Compare Cities
Comparison Subject

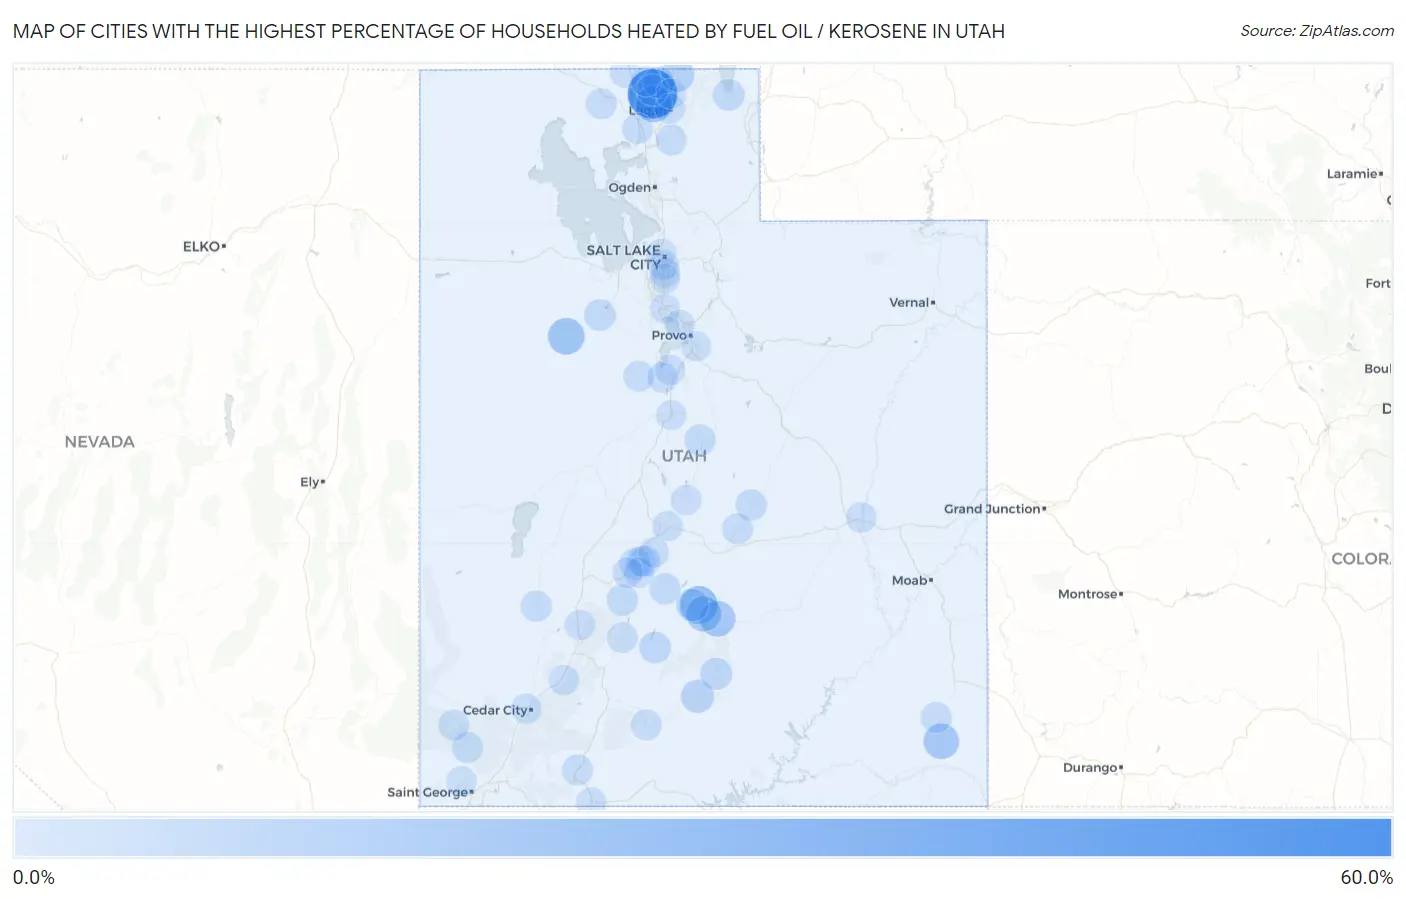
Map of Cities with the Highest Percentage of Households Heated by Fuel Oil / Kerosene in Utah

0.0%
60.0%
Cities with the Highest Percentage of Households Heated by Fuel Oil / Kerosene in Utah Map

Cities with the Highest Percentage of Households Heated by Fuel Oil / Kerosene in Utah

City Fuel Oil Heating vs State vs National
1.Cache54.8%0.10%(+54.7)#14.2%(+50.6)#1,310
2.Lyman20.8%0.10%(+20.7)#24.2%(+16.6)#3,268
3.Peter18.1%0.10%(+18.0)#34.2%(+13.9)#3,545
4.Dugway17.7%0.10%(+17.6)#44.2%(+13.5)#3,581
5.Torrey14.8%0.10%(+14.7)#54.2%(+10.6)#3,935
6.White Mesa14.7%0.10%(+14.6)#64.2%(+10.5)#3,958
7.Bicknell14.2%0.10%(+14.1)#74.2%(+10.00)#4,025
8.Cove9.3%0.10%(+9.20)#84.2%(+5.10)#4,879
9.Escalante7.8%0.10%(+7.70)#94.2%(+3.60)#5,236
10.Loa6.1%0.10%(+6.00)#104.2%(+1.90)#5,770
11.Boulder4.9%0.10%(+4.80)#114.2%(+0.700)#6,238
12.Antimony4.3%0.10%(+4.20)#124.2%(+0.100)#6,524
13.Rush Valley4.2%0.10%(+4.10)#134.2%(=0.000)#6,565
14.Laketown4.2%0.10%(+4.10)#144.2%(=0.000)#6,574
15.Trenton3.7%0.10%(+3.60)#154.2%(-0.500)#6,849
16.Newton3.4%0.10%(+3.30)#164.2%(-0.800)#7,004
17.Marysvale3.4%0.10%(+3.30)#174.2%(-0.800)#7,012
18.Moroni3.2%0.10%(+3.10)#184.2%(-1.00)#7,133
19.Elsinore3.2%0.10%(+3.10)#194.2%(-1.00)#7,136
20.Milford3.1%0.10%(+3.00)#204.2%(-1.10)#7,180
21.Ferron3.1%0.10%(+3.00)#214.2%(-1.10)#7,188
22.Koosharem3.0%0.10%(+2.90)#224.2%(-1.20)#7,303
23.Central2.6%0.10%(+2.50)#234.2%(-1.60)#7,607
24.Annabella2.6%0.10%(+2.50)#244.2%(-1.60)#7,611
25.Blanding2.3%0.10%(+2.20)#254.2%(-1.90)#7,817
26.Orderville2.3%0.10%(+2.20)#264.2%(-1.90)#7,850
27.Avon2.2%0.10%(+2.10)#274.2%(-2.00)#7,950
28.Howell2.2%0.10%(+2.10)#284.2%(-2.00)#7,959
29.Eureka1.8%0.10%(+1.70)#294.2%(-2.40)#8,356
30.Emery1.8%0.10%(+1.70)#304.2%(-2.40)#8,379
31.Cannonville1.8%0.10%(+1.70)#314.2%(-2.40)#8,388
32.Enterprise1.6%0.10%(+1.50)#324.2%(-2.60)#8,555
33.Circleville1.6%0.10%(+1.50)#334.2%(-2.60)#8,586
34.Bear River City1.5%0.10%(+1.40)#344.2%(-2.70)#8,710
35.Goshen1.4%0.10%(+1.30)#354.2%(-2.80)#8,841
36.Portage1.4%0.10%(+1.30)#364.2%(-2.80)#8,873
37.Green River1.3%0.10%(+1.20)#374.2%(-2.90)#8,980
38.Beaver1.1%0.10%(+1.00)#384.2%(-3.10)#9,228
39.Clarkston1.1%0.10%(+1.00)#394.2%(-3.10)#9,294
40.Central Valley1.0%0.10%(+0.900)#404.2%(-3.20)#9,470
41.Monroe0.80%0.10%(+0.700)#414.2%(-3.40)#9,830
42.Paragonah0.80%0.10%(+0.700)#424.2%(-3.40)#9,880
43.Mayfield0.80%0.10%(+0.700)#434.2%(-3.40)#9,901
44.Cedar City0.70%0.10%(+0.600)#444.2%(-3.50)#9,937
45.Genola0.70%0.10%(+0.600)#454.2%(-3.50)#10,096
46.Joseph0.70%0.10%(+0.600)#464.2%(-3.50)#10,159
47.Salina0.60%0.10%(+0.500)#474.2%(-3.60)#10,352
48.Nephi0.50%0.10%(+0.400)#484.2%(-3.70)#10,582
49.Kanab0.50%0.10%(+0.400)#494.2%(-3.70)#10,599
50.Glenwood0.50%0.10%(+0.400)#504.2%(-3.70)#10,744
51.Logan0.40%0.10%(+0.300)#514.2%(-3.80)#10,784
52.Smithfield0.30%0.10%(+0.200)#524.2%(-3.90)#11,156
53.Lehi0.20%0.10%(+0.100)#534.2%(-4.00)#11,361
54.South Salt Lake0.20%0.10%(+0.100)#544.2%(-4.00)#11,454
55.Ivins0.20%0.10%(+0.100)#554.2%(-4.00)#11,587
56.Salt Lake City0.10%0.10%(=0.000)#564.2%(-4.10)#11,703
57.Murray0.10%0.10%(=0.000)#574.2%(-4.10)#11,885
58.Midvale0.10%0.10%(=0.000)#584.2%(-4.10)#11,943
59.Springville0.10%0.10%(=0.000)#594.2%(-4.10)#11,951
60.Vineyard0.10%0.10%(=0.000)#604.2%(-4.10)#12,136

Common Questions

What are the Top 10 Cities with the Highest Percentage of Households Heated by Fuel Oil / Kerosene in Utah?
Top 10 Cities with the Highest Percentage of Households Heated by Fuel Oil / Kerosene in Utah are:
#1
54.8%
#2
20.8%
#3
18.1%
#4
17.7%
#5
14.8%
#6
14.7%
#7
14.2%
#8
9.3%
#9
7.8%
#10
6.1%
What city has the Highest Percentage of Households Heated by Fuel Oil / Kerosene in Utah?
Cache has the Highest Percentage of Households Heated by Fuel Oil / Kerosene in Utah with 54.8%.
What is the Percentage of Households Heated by Fuel Oil / Kerosene in the State of Utah?
Percentage of Households Heated by Fuel Oil / Kerosene in Utah is 0.10%.
What is the Percentage of Households Heated by Fuel Oil / Kerosene in the United States?
Percentage of Households Heated by Fuel Oil / Kerosene in the United States is 4.2%.