Zip Codes with the Highest Percentage of Households Heated by Fuel Oil / Kerosene in Tacoma, WA

RELATED REPORTS & OPTIONS

Fuel Oil Heating
Population
Families and Households
Female Fertility
Female Fertility (Unmarried)
Race (Community Size)
Race (Percentage)
Ancestry (Community Size)
AfricanAlaska NativeAlaskan AthabascanAlbanianAleutAmericanApacheArabArgentineanArmenianAustralianAustrianBangladeshiBasqueBelgianBelizeanBhutaneseBlackfeetBolivianBrazilianBritishBulgarianBurmeseCanadianCelticCentral AmericanCentral American IndianCherokeeChickasawChileanChippewaChoctawColombianColvilleComancheCosta RicanCreeCreekCroatianCubanCzechCzechoslovakianDanishDelawareDominicanDutchEastern EuropeanEcuadorianEgyptianEnglishEstonianEthiopianEuropeanFijianFilipinoFinnishFrenchFrench American IndianFrench CanadianGermanGerman RussianGhanaianGreekGuamanian / ChamorroGuatemalanHaitianHonduranHopiHungarianIcelanderIndian (Asian)IndonesianInupiatIranianIrishIroquoisIsraeliItalianJamaicanJapaneseKenyanKoreanLaotianLatvianLebaneseLithuanianMacedonianMalaysianMexicanMexican American IndianMoroccanNative HawaiianNavajoNew ZealanderNicaraguanNigerianNorthern EuropeanNorwegianOsagePakistaniPalestinianPanamanianPennsylvania GermanPeruvianPolishPortuguesePuebloPuerto RicanPuget Sound SalishRomanianRussianSalvadoranSamoanScandinavianScotch-IrishScottishSerbianShoshoneSiouxSlavicSlovakSloveneSomaliSouth AfricanSouth AmericanSpaniardSpanishSri LankanSubsaharan AfricanSwedishSwissSyrianThaiTlingit-HaidaTonganTrinidadian and TobagonianTsimshianTurkishUgandanUkrainianVenezuelanVietnameseWelshWest IndianYakamaYaquiYugoslavianYup'ik
Ancestry (Percentage)
AfricanAlaska NativeAlaskan AthabascanAlbanianAleutAmericanApacheArabArgentineanArmenianAustralianAustrianBangladeshiBasqueBelgianBelizeanBhutaneseBlackfeetBolivianBrazilianBritishBulgarianBurmeseCanadianCelticCentral AmericanCentral American IndianCherokeeChickasawChileanChippewaChoctawColombianColvilleComancheCosta RicanCreeCreekCroatianCubanCzechCzechoslovakianDanishDelawareDominicanDutchEastern EuropeanEcuadorianEgyptianEnglishEstonianEthiopianEuropeanFijianFilipinoFinnishFrenchFrench American IndianFrench CanadianGermanGerman RussianGhanaianGreekGuamanian / ChamorroGuatemalanHaitianHonduranHopiHungarianIcelanderIndian (Asian)IndonesianInupiatIranianIrishIroquoisIsraeliItalianJamaicanJapaneseKenyanKoreanLaotianLatvianLebaneseLithuanianMacedonianMalaysianMexicanMexican American IndianMoroccanNative HawaiianNavajoNew ZealanderNicaraguanNigerianNorthern EuropeanNorwegianOsagePakistaniPalestinianPanamanianPennsylvania GermanPeruvianPolishPortuguesePuebloPuerto RicanPuget Sound SalishRomanianRussianSalvadoranSamoanScandinavianScotch-IrishScottishSerbianShoshoneSiouxSlavicSlovakSloveneSomaliSouth AfricanSouth AmericanSpaniardSpanishSri LankanSubsaharan AfricanSwedishSwissSyrianThaiTlingit-HaidaTonganTrinidadian and TobagonianTsimshianTurkishUgandanUkrainianVenezuelanVietnameseWelshWest IndianYakamaYaquiYugoslavianYup'ik
Immigrant Origin (Total)
AfricaArgentinaAsiaAustraliaBangladeshBelarusBelizeBrazilBulgariaBurma / MyanmarCambodiaCameroonCanadaCaribbeanCentral AmericaChileChinaColombiaCosta RicaCubaCzechoslovakiaDenmarkDominican RepublicEastern AfricaEastern AsiaEastern EuropeEcuadorEgyptEl SalvadorEnglandEthiopiaEuropeFijiFranceGermanyGhanaGreeceGuatemalaHaitiHondurasHong KongIndiaIndonesiaIranIrelandIsraelItalyJamaicaJapanKazakhstanKenyaKoreaLaosLatin AmericaLatviaLiberiaMexicoMicronesiaMiddle AfricaMoldovaNetherlandsNicaraguaNigeriaNorthern AfricaNorthern EuropeNorwayOceaniaPakistanPanamaPeruPhilippinesPolandRomaniaRussiaSaudi ArabiaScotlandSomaliaSouth AfricaSouth AmericaSouth Central AsiaSouth Eastern AsiaSouthern EuropeSpainSwedenSwitzerlandTaiwanThailandTrinidad and TobagoTurkeyUgandaUkraineUzbekistanVenezuelaVietnamWestern AfricaWestern AsiaWestern EuropeYemenZimbabwe
Immigrant Origin (Percentage)
AfricaArgentinaAsiaAustraliaBangladeshBelarusBelizeBrazilBulgariaBurma / MyanmarCambodiaCameroonCanadaCaribbeanCentral AmericaChileChinaColombiaCosta RicaCubaCzechoslovakiaDenmarkDominican RepublicEastern AfricaEastern AsiaEastern EuropeEcuadorEgyptEl SalvadorEnglandEthiopiaEuropeFijiFranceGermanyGhanaGreeceGuatemalaHaitiHondurasHong KongIndiaIndonesiaIranIrelandIsraelItalyJamaicaJapanKazakhstanKenyaKoreaLaosLatin AmericaLatviaLiberiaMexicoMicronesiaMiddle AfricaMoldovaNetherlandsNicaraguaNigeriaNorthern AfricaNorthern EuropeNorwayOceaniaPakistanPanamaPeruPhilippinesPolandRomaniaRussiaSaudi ArabiaScotlandSomaliaSouth AfricaSouth AmericaSouth Central AsiaSouth Eastern AsiaSouthern EuropeSpainSwedenSwitzerlandTaiwanThailandTrinidad and TobagoTurkeyUgandaUkraineUzbekistanVenezuelaVietnamWestern AfricaWestern AsiaWestern EuropeYemenZimbabwe
Income
Income (Families)
Income (Households)
Poverty
Poverty (Families)
Unemployment
Employment Occupations
Employment Industries
Employer Class
Commute Time
Commute Means
School Enrollment
Education by Degree Field
Occupancy
Finances
Physical Characteristics
Tacoma
Compare Zip Codes
Comparison Subject

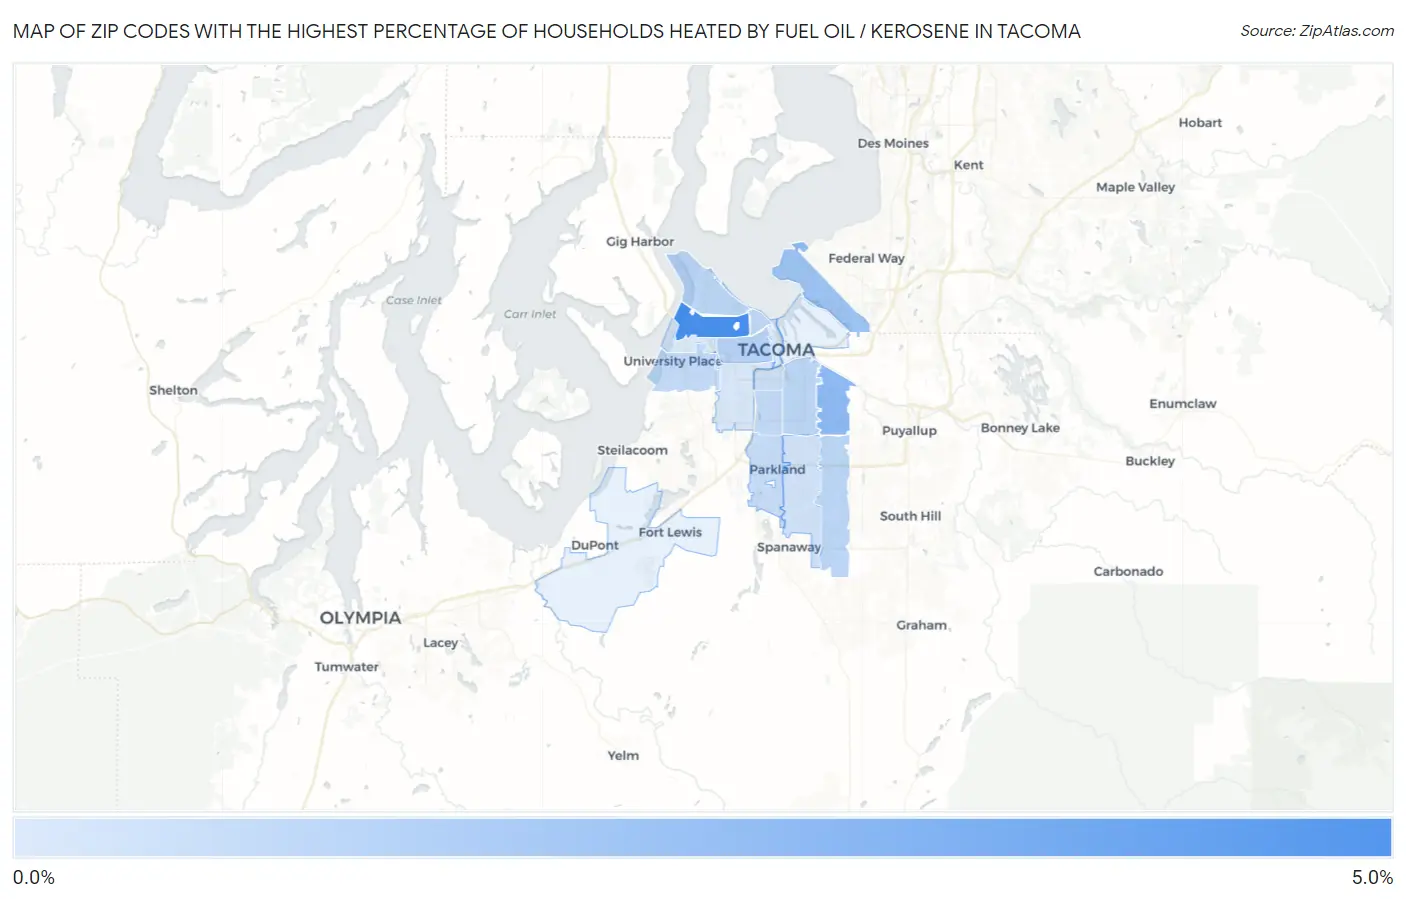
Map of Zip Codes with the Highest Percentage of Households Heated by Fuel Oil / Kerosene in Tacoma

0.0%
5.0%
Zip Codes with the Highest Percentage of Households Heated by Fuel Oil / Kerosene in Tacoma Map

Zip Codes with the Highest Percentage of Households Heated by Fuel Oil / Kerosene in Tacoma, WA

Zip Code Fuel Oil Heating vs State vs National
1.984064.1%1.5%(+2.60)#854.2%(-0.100)#8,713
2.984432.3%1.5%(+0.800)#1364.2%(-1.90)#10,488
3.984221.9%1.5%(+0.400)#1584.2%(-2.30)#11,025
4.984051.3%1.5%(-0.200)#2164.2%(-2.90)#12,075
5.984041.2%1.5%(-0.300)#2234.2%(-3.00)#12,265
6.984071.2%1.5%(-0.300)#2264.2%(-3.00)#12,286
7.984461.2%1.5%(-0.300)#2274.2%(-3.00)#12,309
8.984031.1%1.5%(-0.400)#2334.2%(-3.10)#12,540
9.984661.0%1.5%(-0.500)#2394.2%(-3.20)#12,706
10.984081.0%1.5%(-0.500)#2434.2%(-3.20)#12,725
11.984440.90%1.5%(-0.600)#2514.2%(-3.30)#12,956
12.984180.80%1.5%(-0.700)#2774.2%(-3.40)#13,347
13.984450.70%1.5%(-0.800)#2834.2%(-3.50)#13,556
14.984090.50%1.5%(-1.000)#3254.2%(-3.70)#14,370
15.984650.40%1.5%(-1.10)#3454.2%(-3.80)#15,034
16.984020.40%1.5%(-1.10)#3464.2%(-3.80)#15,044

Common Questions

What are the Top 10 Zip Codes with the Highest Percentage of Households Heated by Fuel Oil / Kerosene in Tacoma, WA?
Top 10 Zip Codes with the Highest Percentage of Households Heated by Fuel Oil / Kerosene in Tacoma, WA are:
#1
4.1%
#2
2.3%
#3
1.9%
#4
1.3%
#5
1.2%
#6
1.2%
#7
1.2%
#8
1.1%
#9
1.0%
#10
1.0%
What zip code has the Highest Percentage of Households Heated by Fuel Oil / Kerosene in Tacoma, WA?
98406 has the Highest Percentage of Households Heated by Fuel Oil / Kerosene in Tacoma, WA with 4.1%.
What is the Percentage of Households Heated by Fuel Oil / Kerosene in Tacoma, WA?
Percentage of Households Heated by Fuel Oil / Kerosene in Tacoma is 1.3%.
What is the Percentage of Households Heated by Fuel Oil / Kerosene in Washington?
Percentage of Households Heated by Fuel Oil / Kerosene in Washington is 1.5%.
What is the Percentage of Households Heated by Fuel Oil / Kerosene in the United States?
Percentage of Households Heated by Fuel Oil / Kerosene in the United States is 4.2%.