Cities with the Highest Percentage of Households Heated by Fuel Oil / Kerosene in Connecticut
RELATED REPORTS & OPTIONS
Fuel Oil Heating
Connecticut
Compare Cities
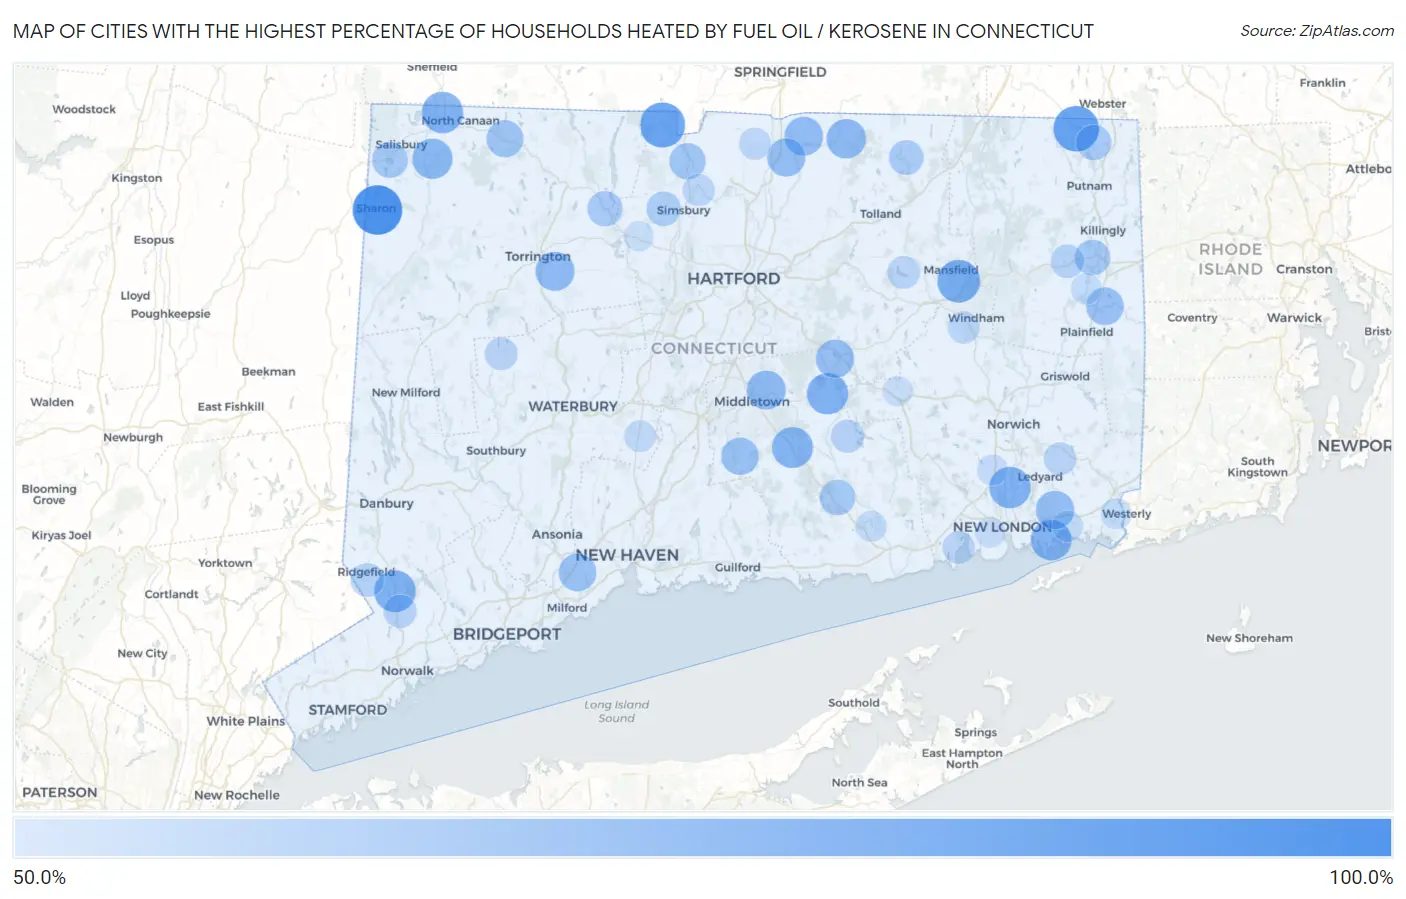
Map of Cities with the Highest Percentage of Households Heated by Fuel Oil / Kerosene in Connecticut
0.0%
100.0%
Cities with the Highest Percentage of Households Heated by Fuel Oil / Kerosene in Connecticut
| City | Fuel Oil Heating | vs State | vs National | |
| 1. | West Mountain | 100.0% | 37.9%(+62.1)#1 | 4.2%(+95.8)#6 |
| 2. | Sharon | 100.0% | 37.9%(+62.1)#2 | 4.2%(+95.8)#7 |
| 3. | Topstone | 100.0% | 37.9%(+62.1)#3 | 4.2%(+95.8)#21 |
| 4. | Brookfield Center | 100.0% | 37.9%(+62.1)#4 | 4.2%(+95.8)#23 |
| 5. | Witches Woods | 94.4% | 37.9%(+56.5)#5 | 4.2%(+90.2)#131 |
| 6. | Dayville | 93.8% | 37.9%(+55.9)#6 | 4.2%(+89.6)#139 |
| 7. | Candlewood Isle | 92.6% | 37.9%(+54.7)#7 | 4.2%(+88.4)#149 |
| 8. | Riverton | 92.6% | 37.9%(+54.7)#8 | 4.2%(+88.4)#150 |
| 9. | Quinebaug | 90.5% | 37.9%(+52.6)#9 | 4.2%(+86.3)#168 |
| 10. | North Granby | 89.6% | 37.9%(+51.7)#10 | 4.2%(+85.4)#173 |
| 11. | Redding Center | 87.8% | 37.9%(+49.9)#11 | 4.2%(+83.6)#193 |
| 12. | Mamanasco Lake | 85.6% | 37.9%(+47.7)#12 | 4.2%(+81.4)#220 |
| 13. | Bigelow Corners | 84.9% | 37.9%(+47.0)#13 | 4.2%(+80.7)#233 |
| 14. | Lakes West | 84.5% | 37.9%(+46.6)#14 | 4.2%(+80.3)#236 |
| 15. | Gaylordsville | 84.3% | 37.9%(+46.4)#15 | 4.2%(+80.1)#243 |
| 16. | Mansfield Center | 84.2% | 37.9%(+46.3)#16 | 4.2%(+80.0)#246 |
| 17. | Lakes East | 84.0% | 37.9%(+46.1)#17 | 4.2%(+79.8)#249 |
| 18. | Georgetown | 81.4% | 37.9%(+43.5)#18 | 4.2%(+77.2)#301 |
| 19. | Cornwall | 81.1% | 37.9%(+43.2)#19 | 4.2%(+76.9)#305 |
| 20. | Gales Ferry | 80.7% | 37.9%(+42.8)#20 | 4.2%(+76.5)#313 |
| 21. | East Hampton | 80.6% | 37.9%(+42.7)#21 | 4.2%(+76.4)#314 |
| 22. | Canaan | 80.6% | 37.9%(+42.7)#22 | 4.2%(+76.4)#315 |
| 23. | Higganum | 79.6% | 37.9%(+41.7)#23 | 4.2%(+75.4)#332 |
| 24. | Noank | 79.1% | 37.9%(+41.2)#24 | 4.2%(+74.9)#341 |
| 25. | Falls Village | 77.9% | 37.9%(+40.0)#25 | 4.2%(+73.7)#371 |
| 26. | Lakeside Woods | 77.2% | 37.9%(+39.3)#26 | 4.2%(+73.0)#390 |
| 27. | Somers | 76.2% | 37.9%(+38.3)#27 | 4.2%(+72.0)#415 |
| 28. | Branchville | 75.9% | 37.9%(+38.0)#28 | 4.2%(+71.7)#426 |
| 29. | Northford | 75.6% | 37.9%(+37.7)#29 | 4.2%(+71.4)#432 |
| 30. | Northwest Harwinton | 75.4% | 37.9%(+37.5)#30 | 4.2%(+71.2)#440 |
| 31. | Portland | 75.3% | 37.9%(+37.4)#31 | 4.2%(+71.1)#444 |
| 32. | Hazardville | 74.4% | 37.9%(+36.5)#32 | 4.2%(+70.2)#466 |
| 33. | Old Mystic | 73.9% | 37.9%(+36.0)#33 | 4.2%(+69.7)#485 |
| 34. | Southwood Acres | 73.3% | 37.9%(+35.4)#34 | 4.2%(+69.1)#502 |
| 35. | Terramuggus | 73.3% | 37.9%(+35.4)#35 | 4.2%(+69.1)#506 |
| 36. | Litchfield Borough | 72.6% | 37.9%(+34.7)#36 | 4.2%(+68.4)#536 |
| 37. | Botsford | 72.1% | 37.9%(+34.2)#37 | 4.2%(+67.9)#554 |
| 38. | Orange | 72.0% | 37.9%(+34.1)#38 | 4.2%(+67.8)#555 |
| 39. | Moosup | 71.9% | 37.9%(+34.0)#39 | 4.2%(+67.7)#558 |
| 40. | Durham | 71.5% | 37.9%(+33.6)#40 | 4.2%(+67.3)#568 |
| 41. | Dodgingtown | 70.9% | 37.9%(+33.0)#41 | 4.2%(+66.7)#593 |
| 42. | Norfolk | 70.4% | 37.9%(+32.5)#42 | 4.2%(+66.2)#612 |
| 43. | Candlewood Orchards | 70.2% | 37.9%(+32.3)#43 | 4.2%(+66.0)#618 |
| 44. | Candlewood Shores | 69.5% | 37.9%(+31.6)#44 | 4.2%(+65.3)#645 |
| 45. | Salmon Brook | 68.8% | 37.9%(+30.9)#45 | 4.2%(+64.6)#672 |
| 46. | Sandy Hook | 68.6% | 37.9%(+30.7)#46 | 4.2%(+64.4)#681 |
| 47. | Lakeville | 67.8% | 37.9%(+29.9)#47 | 4.2%(+63.6)#709 |
| 48. | Mechanicsville | 67.5% | 37.9%(+29.6)#48 | 4.2%(+63.3)#724 |
| 49. | Chester Center | 67.3% | 37.9%(+29.4)#49 | 4.2%(+63.1)#733 |
| 50. | Tokeneke | 67.2% | 37.9%(+29.3)#50 | 4.2%(+63.0)#737 |
| 51. | East Brooklyn | 67.2% | 37.9%(+29.3)#51 | 4.2%(+63.0)#738 |
| 52. | Jewett City Borough | 66.8% | 37.9%(+28.9)#52 | 4.2%(+62.6)#744 |
| 53. | North Grosvenor Dale | 66.7% | 37.9%(+28.8)#53 | 4.2%(+62.5)#751 |
| 54. | Candlewood Knolls | 66.7% | 37.9%(+28.8)#54 | 4.2%(+62.5)#754 |
| 55. | Noroton | 66.1% | 37.9%(+28.2)#55 | 4.2%(+61.9)#779 |
| 56. | New Hartford Center | 66.1% | 37.9%(+28.2)#56 | 4.2%(+61.9)#780 |
| 57. | Newtown Borough | 65.7% | 37.9%(+27.8)#57 | 4.2%(+61.5)#796 |
| 58. | Stafford Springs | 65.2% | 37.9%(+27.3)#58 | 4.2%(+61.0)#823 |
| 59. | West Simsbury | 64.7% | 37.9%(+26.8)#59 | 4.2%(+60.5)#846 |
| 60. | Poplar Plains | 64.1% | 37.9%(+26.2)#60 | 4.2%(+59.9)#877 |
| 61. | Coleytown | 63.3% | 37.9%(+25.4)#61 | 4.2%(+59.1)#911 |
| 62. | Brooklyn | 62.8% | 37.9%(+24.9)#62 | 4.2%(+58.6)#932 |
| 63. | Ridgefield | 62.7% | 37.9%(+24.8)#63 | 4.2%(+58.5)#933 |
| 64. | Noroton Heights | 62.6% | 37.9%(+24.7)#64 | 4.2%(+58.4)#936 |
| 65. | Old Hill | 61.9% | 37.9%(+24.0)#65 | 4.2%(+57.7)#971 |
| 66. | Cannondale | 61.8% | 37.9%(+23.9)#66 | 4.2%(+57.6)#977 |
| 67. | Moodus | 61.6% | 37.9%(+23.7)#67 | 4.2%(+57.4)#981 |
| 68. | West Cornwall | 61.5% | 37.9%(+23.6)#68 | 4.2%(+57.3)#991 |
| 69. | Ball Pond | 60.9% | 37.9%(+23.0)#69 | 4.2%(+56.7)#1,016 |
| 70. | Bethlehem Village | 60.9% | 37.9%(+23.0)#70 | 4.2%(+56.7)#1,017 |
| 71. | Mashantucket | 60.7% | 37.9%(+22.8)#71 | 4.2%(+56.5)#1,023 |
| 72. | Taylor Corners | 60.6% | 37.9%(+22.7)#72 | 4.2%(+56.4)#1,026 |
| 73. | South Coventry | 60.5% | 37.9%(+22.6)#73 | 4.2%(+56.3)#1,032 |
| 74. | Niantic | 60.3% | 37.9%(+22.4)#74 | 4.2%(+56.1)#1,038 |
| 75. | Ridgebury | 60.1% | 37.9%(+22.2)#75 | 4.2%(+55.9)#1,046 |
| 76. | Saugatuck | 59.7% | 37.9%(+21.8)#76 | 4.2%(+55.5)#1,077 |
| 77. | Knollcrest | 59.7% | 37.9%(+21.8)#77 | 4.2%(+55.5)#1,079 |
| 78. | South Windham | 59.5% | 37.9%(+21.6)#78 | 4.2%(+55.3)#1,085 |
| 79. | Stepney | 59.2% | 37.9%(+21.3)#79 | 4.2%(+55.0)#1,103 |
| 80. | Pleasant Valley | 59.2% | 37.9%(+21.3)#80 | 4.2%(+55.0)#1,105 |
| 81. | Suffield Depot | 59.1% | 37.9%(+21.2)#81 | 4.2%(+54.9)#1,110 |
| 82. | Tariffville | 59.1% | 37.9%(+21.2)#82 | 4.2%(+54.9)#1,111 |
| 83. | Westport | 58.5% | 37.9%(+20.6)#83 | 4.2%(+54.3)#1,139 |
| 84. | Cheshire Village | 58.3% | 37.9%(+20.4)#84 | 4.2%(+54.1)#1,149 |
| 85. | Weston | 58.2% | 37.9%(+20.3)#85 | 4.2%(+54.0)#1,156 |
| 86. | Darien Downtown | 57.4% | 37.9%(+19.5)#86 | 4.2%(+53.2)#1,186 |
| 87. | Mystic | 57.2% | 37.9%(+19.3)#87 | 4.2%(+53.0)#1,191 |
| 88. | Stonington Borough | 57.2% | 37.9%(+19.3)#88 | 4.2%(+53.0)#1,194 |
| 89. | Pawcatuck | 57.0% | 37.9%(+19.1)#89 | 4.2%(+52.8)#1,209 |
| 90. | Essex Village | 56.9% | 37.9%(+19.0)#90 | 4.2%(+52.7)#1,215 |
| 91. | East | 56.7% | 37.9%(+18.8)#91 | 4.2%(+52.5)#1,224 |
| 92. | Oxoboxo River | 56.6% | 37.9%(+18.7)#92 | 4.2%(+52.4)#1,228 |
| 93. | Wauregan | 56.6% | 37.9%(+18.7)#93 | 4.2%(+52.4)#1,229 |
| 94. | Inglenook | 56.6% | 37.9%(+18.7)#94 | 4.2%(+52.4)#1,230 |
| 95. | Bridgewater | 56.4% | 37.9%(+18.5)#95 | 4.2%(+52.2)#1,240 |
| 96. | Bogus Hill | 56.1% | 37.9%(+18.2)#96 | 4.2%(+51.9)#1,249 |
| 97. | Waterford | 55.5% | 37.9%(+17.6)#97 | 4.2%(+51.3)#1,278 |
| 98. | Colchester | 55.4% | 37.9%(+17.5)#98 | 4.2%(+51.2)#1,281 |
| 99. | Canton Valley | 55.0% | 37.9%(+17.1)#99 | 4.2%(+50.8)#1,300 |
| 100. | Bantam Borough | 54.1% | 37.9%(+16.2)#100 | 4.2%(+49.9)#1,346 |
Common Questions
What are the Top 10 Cities with the Highest Percentage of Households Heated by Fuel Oil / Kerosene in Connecticut?
Top 10 Cities with the Highest Percentage of Households Heated by Fuel Oil / Kerosene in Connecticut are:
#1
100.0%
#2
90.5%
#3
89.6%
#4
84.2%
#5
81.4%
#6
80.7%
#7
80.6%
#8
80.6%
#9
79.6%
#10
79.1%
What city has the Highest Percentage of Households Heated by Fuel Oil / Kerosene in Connecticut?
Sharon has the Highest Percentage of Households Heated by Fuel Oil / Kerosene in Connecticut with 100.0%.
What is the Percentage of Households Heated by Fuel Oil / Kerosene in the State of Connecticut?
Percentage of Households Heated by Fuel Oil / Kerosene in Connecticut is 37.9%.
What is the Percentage of Households Heated by Fuel Oil / Kerosene in the United States?
Percentage of Households Heated by Fuel Oil / Kerosene in the United States is 4.2%.