Cities with the Highest Percentage of Households Heated by Fuel Oil / Kerosene in Ohio
RELATED REPORTS & OPTIONS
Fuel Oil Heating
Ohio
Compare Cities
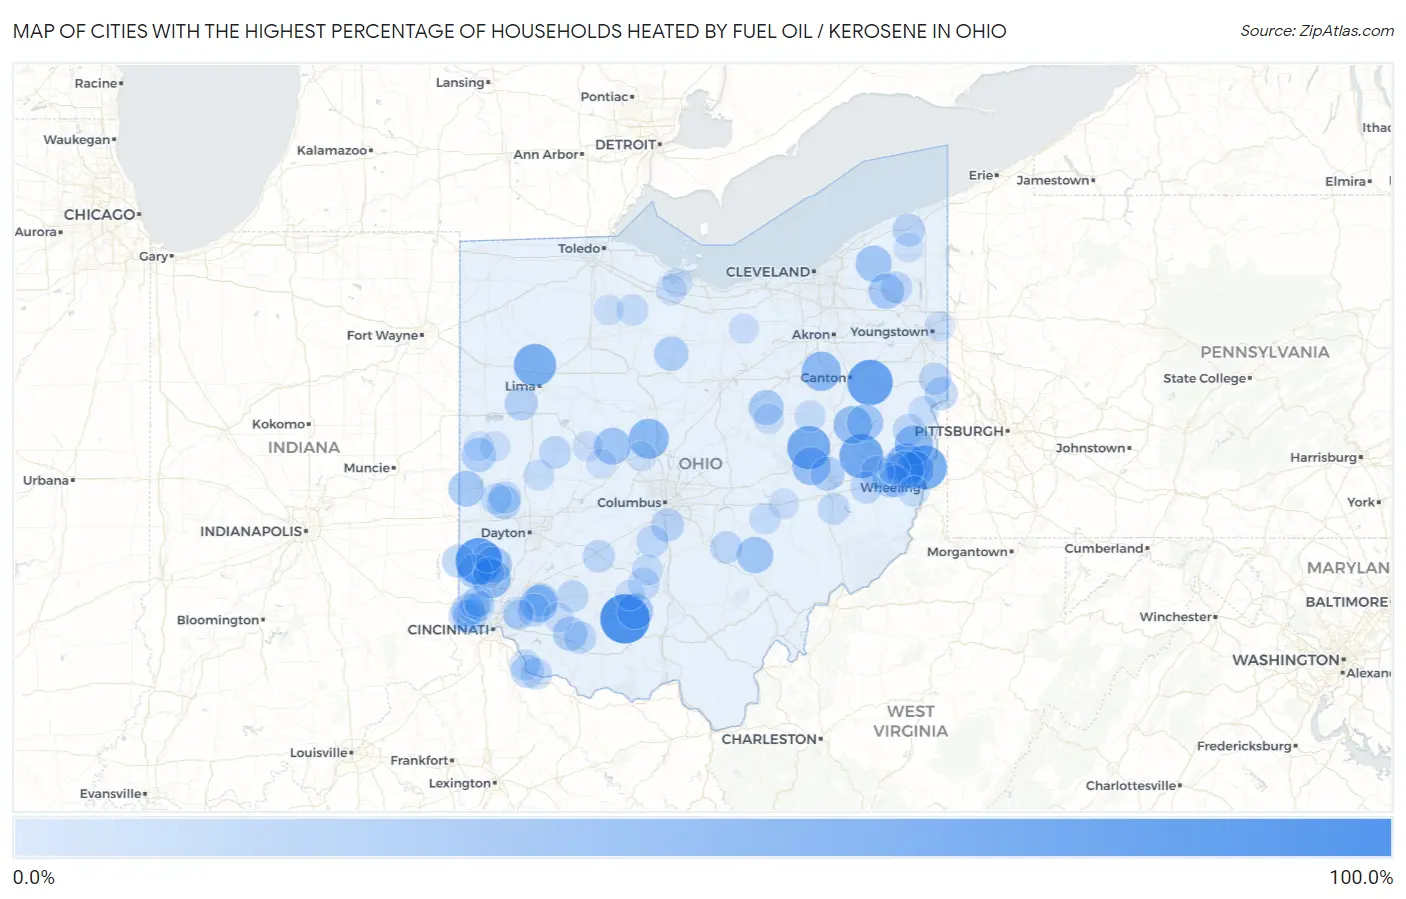
Map of Cities with the Highest Percentage of Households Heated by Fuel Oil / Kerosene in Ohio
0.0%
100.0%
Cities with the Highest Percentage of Households Heated by Fuel Oil / Kerosene in Ohio
| City | Fuel Oil Heating | vs State | vs National | |
| 1. | Cynthiana | 100.0% | 1.9%(+98.1)#1 | 4.2%(+95.8)#80 |
| 2. | Somerville | 84.7% | 1.9%(+82.8)#2 | 4.2%(+80.5)#234 |
| 3. | Robertsville | 81.3% | 1.9%(+79.4)#3 | 4.2%(+77.1)#303 |
| 4. | Connorville | 73.3% | 1.9%(+71.4)#4 | 4.2%(+69.1)#512 |
| 5. | Tippecanoe | 73.2% | 1.9%(+71.3)#5 | 4.2%(+69.0)#515 |
| 6. | Fresno | 70.0% | 1.9%(+68.1)#6 | 4.2%(+65.8)#630 |
| 7. | Vaughnsville | 66.1% | 1.9%(+64.2)#7 | 4.2%(+61.9)#785 |
| 8. | Adena | 58.7% | 1.9%(+56.8)#8 | 4.2%(+54.5)#1,128 |
| 9. | Radnor | 55.3% | 1.9%(+53.4)#9 | 4.2%(+51.1)#1,287 |
| 10. | North Lawrence | 51.5% | 1.9%(+49.6)#10 | 4.2%(+47.3)#1,480 |
| 11. | Williamsdale | 51.0% | 1.9%(+49.1)#11 | 4.2%(+46.8)#1,501 |
| 12. | Bloomingdale | 48.7% | 1.9%(+46.8)#12 | 4.2%(+44.5)#1,613 |
| 13. | Roachester | 47.1% | 1.9%(+45.2)#13 | 4.2%(+42.9)#1,679 |
| 14. | Plainfield | 46.1% | 1.9%(+44.2)#14 | 4.2%(+41.9)#1,717 |
| 15. | Mount Pleasant | 45.7% | 1.9%(+43.8)#15 | 4.2%(+41.5)#1,731 |
| 16. | Roswell | 45.7% | 1.9%(+43.8)#16 | 4.2%(+41.5)#1,733 |
| 17. | Harrisville | 45.6% | 1.9%(+43.7)#17 | 4.2%(+41.4)#1,737 |
| 18. | Pleasant Plain | 43.1% | 1.9%(+41.2)#18 | 4.2%(+38.9)#1,848 |
| 19. | Raymond | 40.8% | 1.9%(+38.9)#19 | 4.2%(+36.6)#1,971 |
| 20. | Shawnee | 38.7% | 1.9%(+36.8)#20 | 4.2%(+34.5)#2,083 |
| 21. | Sherrodsville | 38.7% | 1.9%(+36.8)#21 | 4.2%(+34.5)#2,084 |
| 22. | Jacksonburg | 38.5% | 1.9%(+36.6)#22 | 4.2%(+34.3)#2,098 |
| 23. | Aquilla | 38.0% | 1.9%(+36.1)#23 | 4.2%(+33.8)#2,118 |
| 24. | Bainbridge | 36.1% | 1.9%(+34.2)#24 | 4.2%(+31.9)#2,194 |
| 25. | Palestine | 36.0% | 1.9%(+34.1)#25 | 4.2%(+31.8)#2,203 |
| 26. | Parkman | 34.7% | 1.9%(+32.8)#26 | 4.2%(+30.5)#2,271 |
| 27. | Nashville | 33.0% | 1.9%(+31.1)#27 | 4.2%(+28.8)#2,359 |
| 28. | Lafferty | 31.4% | 1.9%(+29.5)#28 | 4.2%(+27.2)#2,467 |
| 29. | Darrtown | 30.2% | 1.9%(+28.3)#29 | 4.2%(+26.0)#2,540 |
| 30. | Chatfield | 29.9% | 1.9%(+28.0)#30 | 4.2%(+25.7)#2,567 |
| 31. | Buford | 29.4% | 1.9%(+27.5)#31 | 4.2%(+25.2)#2,597 |
| 32. | Kimbolton | 28.4% | 1.9%(+26.5)#32 | 4.2%(+24.2)#2,655 |
| 33. | Rossburg | 28.3% | 1.9%(+26.4)#33 | 4.2%(+24.1)#2,664 |
| 34. | Grandview | 26.4% | 1.9%(+24.5)#34 | 4.2%(+22.2)#2,805 |
| 35. | Potsdam | 26.4% | 1.9%(+24.5)#35 | 4.2%(+22.2)#2,808 |
| 36. | Marathon | 25.5% | 1.9%(+23.6)#36 | 4.2%(+21.3)#2,872 |
| 37. | Butlerville | 25.3% | 1.9%(+23.4)#37 | 4.2%(+21.1)#2,880 |
| 38. | College Corner | 25.2% | 1.9%(+23.3)#38 | 4.2%(+21.0)#2,888 |
| 39. | Buckland | 25.0% | 1.9%(+23.1)#39 | 4.2%(+20.8)#2,902 |
| 40. | Neville | 24.0% | 1.9%(+22.1)#40 | 4.2%(+19.8)#2,991 |
| 41. | Calcutta | 23.9% | 1.9%(+22.0)#41 | 4.2%(+19.7)#2,994 |
| 42. | Lockbourne | 23.9% | 1.9%(+22.0)#42 | 4.2%(+19.7)#3,002 |
| 43. | Holloway | 23.8% | 1.9%(+21.9)#43 | 4.2%(+19.6)#3,008 |
| 44. | Blue Jay | 22.3% | 1.9%(+20.4)#44 | 4.2%(+18.1)#3,123 |
| 45. | Goshen | 22.1% | 1.9%(+20.2)#45 | 4.2%(+17.9)#3,146 |
| 46. | New Springfield | 22.0% | 1.9%(+20.1)#46 | 4.2%(+17.8)#3,158 |
| 47. | Austinburg | 22.0% | 1.9%(+20.1)#47 | 4.2%(+17.8)#3,160 |
| 48. | Hooven | 21.5% | 1.9%(+19.6)#48 | 4.2%(+17.3)#3,211 |
| 49. | Mowrystown | 21.5% | 1.9%(+19.6)#49 | 4.2%(+17.3)#3,212 |
| 50. | Milledgeville | 20.8% | 1.9%(+18.9)#50 | 4.2%(+16.6)#3,270 |
| 51. | Quincy | 20.7% | 1.9%(+18.8)#51 | 4.2%(+16.5)#3,278 |
| 52. | Laura | 20.5% | 1.9%(+18.6)#52 | 4.2%(+16.3)#3,292 |
| 53. | Rogers | 20.5% | 1.9%(+18.6)#53 | 4.2%(+16.3)#3,295 |
| 54. | Hide A Way Hills | 20.4% | 1.9%(+18.5)#54 | 4.2%(+16.2)#3,308 |
| 55. | Brandt | 19.4% | 1.9%(+17.5)#55 | 4.2%(+15.2)#3,406 |
| 56. | Darbyville | 19.2% | 1.9%(+17.3)#56 | 4.2%(+15.0)#3,433 |
| 57. | Fairview | 19.2% | 1.9%(+17.3)#57 | 4.2%(+15.0)#3,434 |
| 58. | New Haven Cdp Hamilton County | 19.1% | 1.9%(+17.2)#58 | 4.2%(+14.9)#3,439 |
| 59. | Bannock | 19.0% | 1.9%(+17.1)#59 | 4.2%(+14.8)#3,444 |
| 60. | East Springfield | 19.0% | 1.9%(+17.1)#60 | 4.2%(+14.8)#3,447 |
| 61. | West Farmington | 18.9% | 1.9%(+17.0)#61 | 4.2%(+14.7)#3,451 |
| 62. | Martinsville | 18.9% | 1.9%(+17.0)#62 | 4.2%(+14.7)#3,452 |
| 63. | Frankfort | 18.6% | 1.9%(+16.7)#63 | 4.2%(+14.4)#3,476 |
| 64. | Buffalo | 18.5% | 1.9%(+16.6)#64 | 4.2%(+14.3)#3,490 |
| 65. | Chilo | 18.2% | 1.9%(+16.3)#65 | 4.2%(+14.0)#3,534 |
| 66. | New Athens | 17.4% | 1.9%(+15.5)#66 | 4.2%(+13.2)#3,609 |
| 67. | Kansas | 17.0% | 1.9%(+15.1)#67 | 4.2%(+12.8)#3,655 |
| 68. | Pitsburg | 16.8% | 1.9%(+14.9)#68 | 4.2%(+12.6)#3,668 |
| 69. | North Industry | 16.5% | 1.9%(+14.6)#69 | 4.2%(+12.3)#3,712 |
| 70. | Walnut Creek | 16.3% | 1.9%(+14.4)#70 | 4.2%(+12.1)#3,735 |
| 71. | Miamiville | 16.1% | 1.9%(+14.2)#71 | 4.2%(+11.9)#3,767 |
| 72. | Moscow | 16.0% | 1.9%(+14.1)#72 | 4.2%(+11.8)#3,782 |
| 73. | Clarksburg | 15.9% | 1.9%(+14.0)#73 | 4.2%(+11.7)#3,792 |
| 74. | East Fultonham | 15.5% | 1.9%(+13.6)#74 | 4.2%(+11.3)#3,850 |
| 75. | Taylor Creek | 15.1% | 1.9%(+13.2)#75 | 4.2%(+10.9)#3,891 |
| 76. | New Baltimore | 14.3% | 1.9%(+12.4)#76 | 4.2%(+10.1)#4,002 |
| 77. | Neffs | 14.3% | 1.9%(+12.4)#77 | 4.2%(+10.1)#4,004 |
| 78. | Fletcher | 14.3% | 1.9%(+12.4)#78 | 4.2%(+10.1)#4,006 |
| 79. | Dunlap | 14.1% | 1.9%(+12.2)#79 | 4.2%(+9.90)#4,039 |
| 80. | Seven Mile | 13.8% | 1.9%(+11.9)#80 | 4.2%(+9.60)#4,078 |
| 81. | Vickery | 13.8% | 1.9%(+11.9)#81 | 4.2%(+9.60)#4,080 |
| 82. | Irondale | 12.7% | 1.9%(+10.8)#82 | 4.2%(+8.50)#4,226 |
| 83. | Pleasant Grove | 12.6% | 1.9%(+10.7)#83 | 4.2%(+8.40)#4,236 |
| 84. | Camp Dennison | 12.2% | 1.9%(+10.3)#84 | 4.2%(+8.00)#4,302 |
| 85. | Osgood | 12.2% | 1.9%(+10.3)#85 | 4.2%(+8.00)#4,303 |
| 86. | West Millgrove | 12.2% | 1.9%(+10.3)#86 | 4.2%(+8.00)#4,305 |
| 87. | Zanesfield | 12.0% | 1.9%(+10.1)#87 | 4.2%(+7.80)#4,339 |
| 88. | South Salem | 11.8% | 1.9%(+9.90)#88 | 4.2%(+7.60)#4,389 |
| 89. | Newport Cdp Shelby County | 11.8% | 1.9%(+9.90)#89 | 4.2%(+7.60)#4,391 |
| 90. | Glenmont | 11.6% | 1.9%(+9.70)#90 | 4.2%(+7.40)#4,427 |
| 91. | Rochester | 11.5% | 1.9%(+9.60)#91 | 4.2%(+7.30)#4,446 |
| 92. | Maplewood Park | 11.3% | 1.9%(+9.40)#92 | 4.2%(+7.10)#4,475 |
| 93. | Fayetteville | 11.3% | 1.9%(+9.40)#93 | 4.2%(+7.10)#4,476 |
| 94. | West Elkton | 11.3% | 1.9%(+9.40)#94 | 4.2%(+7.10)#4,479 |
| 95. | North Lewisburg | 11.1% | 1.9%(+9.20)#95 | 4.2%(+6.90)#4,501 |
| 96. | New Weston | 11.1% | 1.9%(+9.20)#96 | 4.2%(+6.90)#4,514 |
| 97. | Rock Creek | 11.0% | 1.9%(+9.10)#97 | 4.2%(+6.80)#4,540 |
| 98. | Ostrander | 10.8% | 1.9%(+8.90)#98 | 4.2%(+6.60)#4,565 |
| 99. | Whites Landing | 10.8% | 1.9%(+8.90)#99 | 4.2%(+6.60)#4,571 |
| 100. | Dry Ridge | 10.4% | 1.9%(+8.50)#100 | 4.2%(+6.20)#4,619 |
Common Questions
What are the Top 10 Cities with the Highest Percentage of Households Heated by Fuel Oil / Kerosene in Ohio?
Top 10 Cities with the Highest Percentage of Households Heated by Fuel Oil / Kerosene in Ohio are:
#1
100.0%
#2
84.7%
#3
81.3%
#4
73.3%
#5
73.2%
#6
70.0%
#7
66.1%
#8
58.7%
#9
55.3%
#10
51.5%
What city has the Highest Percentage of Households Heated by Fuel Oil / Kerosene in Ohio?
Cynthiana has the Highest Percentage of Households Heated by Fuel Oil / Kerosene in Ohio with 100.0%.
What is the Percentage of Households Heated by Fuel Oil / Kerosene in the State of Ohio?
Percentage of Households Heated by Fuel Oil / Kerosene in Ohio is 1.9%.
What is the Percentage of Households Heated by Fuel Oil / Kerosene in the United States?
Percentage of Households Heated by Fuel Oil / Kerosene in the United States is 4.2%.