Cities with the Highest Percentage of Households Heated by Fuel Oil / Kerosene in New Hampshire
RELATED REPORTS & OPTIONS
Fuel Oil Heating
New Hampshire
Compare Cities
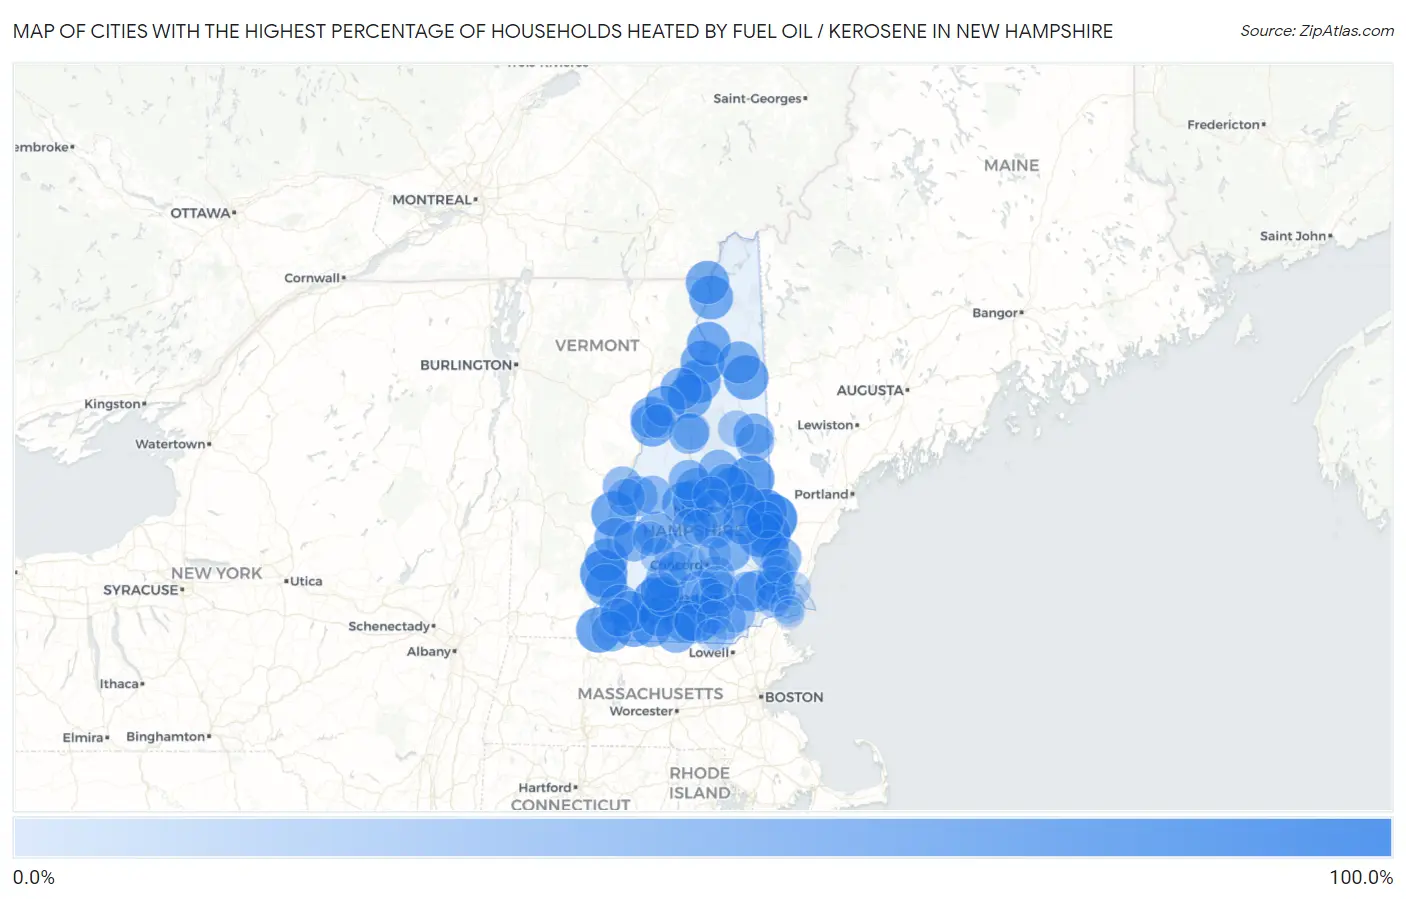
Map of Cities with the Highest Percentage of Households Heated by Fuel Oil / Kerosene in New Hampshire
0.0%
100.0%
Cities with the Highest Percentage of Households Heated by Fuel Oil / Kerosene in New Hampshire
| City | Fuel Oil Heating | vs State | vs National | |
| 1. | New Boston | 100.0% | 41.7%(+58.3)#1 | 4.2%(+95.8)#13 |
| 2. | Milton Mills | 100.0% | 41.7%(+58.3)#2 | 4.2%(+95.8)#32 |
| 3. | Hancock | 89.2% | 41.7%(+47.5)#3 | 4.2%(+85.0)#180 |
| 4. | North Walpole | 89.0% | 41.7%(+47.3)#4 | 4.2%(+84.8)#182 |
| 5. | Amherst | 83.8% | 41.7%(+42.1)#5 | 4.2%(+79.6)#254 |
| 6. | Center Ossipee | 83.7% | 41.7%(+42.0)#6 | 4.2%(+79.5)#257 |
| 7. | Goffstown | 79.0% | 41.7%(+37.3)#7 | 4.2%(+74.8)#343 |
| 8. | Francestown | 78.5% | 41.7%(+36.8)#8 | 4.2%(+74.3)#355 |
| 9. | Hinsdale | 78.3% | 41.7%(+36.6)#9 | 4.2%(+74.1)#359 |
| 10. | Plainfield | 77.1% | 41.7%(+35.4)#10 | 4.2%(+72.9)#392 |
| 11. | Gorham | 74.5% | 41.7%(+32.8)#11 | 4.2%(+70.3)#464 |
| 12. | Sanbornville | 74.1% | 41.7%(+32.4)#12 | 4.2%(+69.9)#480 |
| 13. | Milton | 72.9% | 41.7%(+31.2)#13 | 4.2%(+68.7)#525 |
| 14. | Farmington | 72.8% | 41.7%(+31.1)#14 | 4.2%(+68.6)#526 |
| 15. | Whitefield | 70.6% | 41.7%(+28.9)#15 | 4.2%(+66.4)#599 |
| 16. | Lancaster | 70.5% | 41.7%(+28.8)#16 | 4.2%(+66.3)#604 |
| 17. | Bethlehem | 70.4% | 41.7%(+28.7)#17 | 4.2%(+66.2)#610 |
| 18. | Colebrook | 70.1% | 41.7%(+28.4)#18 | 4.2%(+65.9)#620 |
| 19. | Groveton | 69.6% | 41.7%(+27.9)#19 | 4.2%(+65.4)#642 |
| 20. | Troy | 69.5% | 41.7%(+27.8)#20 | 4.2%(+65.3)#644 |
| 21. | West Stewartstown | 68.5% | 41.7%(+26.8)#21 | 4.2%(+64.3)#689 |
| 22. | Bristol | 67.5% | 41.7%(+25.8)#22 | 4.2%(+63.3)#719 |
| 23. | North Haverhill | 67.4% | 41.7%(+25.7)#23 | 4.2%(+63.2)#727 |
| 24. | Melvin Village | 66.2% | 41.7%(+24.5)#24 | 4.2%(+62.0)#778 |
| 25. | Charlestown | 65.7% | 41.7%(+24.0)#25 | 4.2%(+61.5)#799 |
| 26. | Wolfeboro | 64.7% | 41.7%(+23.0)#26 | 4.2%(+60.5)#845 |
| 27. | New Hampton | 64.2% | 41.7%(+22.5)#27 | 4.2%(+60.0)#875 |
| 28. | Belmont | 62.3% | 41.7%(+20.6)#28 | 4.2%(+58.1)#956 |
| 29. | Walpole | 62.2% | 41.7%(+20.5)#29 | 4.2%(+58.0)#961 |
| 30. | Berlin | 61.6% | 41.7%(+19.9)#30 | 4.2%(+57.4)#980 |
| 31. | Pittsfield | 61.0% | 41.7%(+19.3)#31 | 4.2%(+56.8)#1,010 |
| 32. | Wilton | 60.2% | 41.7%(+18.5)#32 | 4.2%(+56.0)#1,043 |
| 33. | Claremont | 59.9% | 41.7%(+18.2)#33 | 4.2%(+55.7)#1,061 |
| 34. | Littleton | 59.9% | 41.7%(+18.2)#34 | 4.2%(+55.7)#1,062 |
| 35. | Woodsville | 59.8% | 41.7%(+18.1)#35 | 4.2%(+55.6)#1,073 |
| 36. | Epping | 59.4% | 41.7%(+17.7)#36 | 4.2%(+55.2)#1,093 |
| 37. | New London | 59.1% | 41.7%(+17.4)#37 | 4.2%(+54.9)#1,112 |
| 38. | Jaffrey | 57.2% | 41.7%(+15.5)#38 | 4.2%(+53.0)#1,192 |
| 39. | Ashland | 56.2% | 41.7%(+14.5)#39 | 4.2%(+52.0)#1,245 |
| 40. | Keene | 56.0% | 41.7%(+14.3)#40 | 4.2%(+51.8)#1,251 |
| 41. | Lisbon | 55.6% | 41.7%(+13.9)#41 | 4.2%(+51.4)#1,271 |
| 42. | Marlborough | 55.5% | 41.7%(+13.8)#42 | 4.2%(+51.3)#1,279 |
| 43. | Newfields | 55.1% | 41.7%(+13.4)#43 | 4.2%(+50.9)#1,299 |
| 44. | Peterborough | 53.9% | 41.7%(+12.2)#44 | 4.2%(+49.7)#1,356 |
| 45. | North Conway | 53.8% | 41.7%(+12.1)#45 | 4.2%(+49.6)#1,362 |
| 46. | Hillsborough | 53.8% | 41.7%(+12.1)#46 | 4.2%(+49.6)#1,363 |
| 47. | Somersworth | 53.4% | 41.7%(+11.7)#47 | 4.2%(+49.2)#1,383 |
| 48. | Newport | 53.3% | 41.7%(+11.6)#48 | 4.2%(+49.1)#1,388 |
| 49. | Greenville | 53.3% | 41.7%(+11.6)#49 | 4.2%(+49.1)#1,391 |
| 50. | Center Sandwich | 53.3% | 41.7%(+11.6)#50 | 4.2%(+49.1)#1,392 |
| 51. | Suissevale | 52.6% | 41.7%(+10.9)#51 | 4.2%(+48.4)#1,423 |
| 52. | Plymouth | 52.5% | 41.7%(+10.8)#52 | 4.2%(+48.3)#1,426 |
| 53. | Enfield | 52.1% | 41.7%(+10.4)#53 | 4.2%(+47.9)#1,444 |
| 54. | Winchester | 52.0% | 41.7%(+10.3)#54 | 4.2%(+47.8)#1,450 |
| 55. | North Woodstock | 51.3% | 41.7%(+9.60)#55 | 4.2%(+47.1)#1,484 |
| 56. | Bennington | 49.6% | 41.7%(+7.90)#56 | 4.2%(+45.4)#1,580 |
| 57. | Hanover | 49.0% | 41.7%(+7.30)#57 | 4.2%(+44.8)#1,602 |
| 58. | Antrim | 48.1% | 41.7%(+6.40)#58 | 4.2%(+43.9)#1,638 |
| 59. | Londonderry | 47.6% | 41.7%(+5.90)#59 | 4.2%(+43.4)#1,657 |
| 60. | Rochester | 46.9% | 41.7%(+5.20)#60 | 4.2%(+42.7)#1,685 |
| 61. | South Hooksett | 46.9% | 41.7%(+5.20)#61 | 4.2%(+42.7)#1,686 |
| 62. | Alton | 46.5% | 41.7%(+4.80)#62 | 4.2%(+42.3)#1,704 |
| 63. | Raymond | 46.2% | 41.7%(+4.50)#63 | 4.2%(+42.0)#1,712 |
| 64. | Warner | 45.4% | 41.7%(+3.70)#64 | 4.2%(+41.2)#1,750 |
| 65. | Canaan | 44.7% | 41.7%(+3.00)#65 | 4.2%(+40.5)#1,776 |
| 66. | Franklin | 42.9% | 41.7%(+1.20)#66 | 4.2%(+38.7)#1,856 |
| 67. | Laconia | 42.6% | 41.7%(+0.900)#67 | 4.2%(+38.4)#1,874 |
| 68. | Conway | 41.6% | 41.7%(-0.100)#68 | 4.2%(+37.4)#1,937 |
| 69. | West Swanzey | 40.7% | 41.7%(-1.00)#69 | 4.2%(+36.5)#1,974 |
| 70. | Derry | 40.3% | 41.7%(-1.40)#70 | 4.2%(+36.1)#1,992 |
| 71. | Lebanon | 40.0% | 41.7%(-1.70)#71 | 4.2%(+35.8)#2,003 |
| 72. | Durham | 39.0% | 41.7%(-2.70)#72 | 4.2%(+34.8)#2,063 |
| 73. | Contoocook | 38.2% | 41.7%(-3.50)#73 | 4.2%(+34.0)#2,109 |
| 74. | Suncook | 37.0% | 41.7%(-4.70)#74 | 4.2%(+32.8)#2,157 |
| 75. | Milford | 35.9% | 41.7%(-5.80)#75 | 4.2%(+31.7)#2,204 |
| 76. | Lincoln | 35.9% | 41.7%(-5.80)#76 | 4.2%(+31.7)#2,205 |
| 77. | Newmarket | 35.7% | 41.7%(-6.00)#77 | 4.2%(+31.5)#2,213 |
| 78. | Union | 35.6% | 41.7%(-6.10)#78 | 4.2%(+31.4)#2,219 |
| 79. | Meredith | 34.9% | 41.7%(-6.80)#79 | 4.2%(+30.7)#2,252 |
| 80. | Tilton Northfield | 33.2% | 41.7%(-8.50)#80 | 4.2%(+29.0)#2,352 |
| 81. | Bartlett | 33.1% | 41.7%(-8.60)#81 | 4.2%(+28.9)#2,358 |
| 82. | Pinardville | 30.1% | 41.7%(-11.6)#82 | 4.2%(+25.9)#2,546 |
| 83. | Dover | 28.5% | 41.7%(-13.2)#83 | 4.2%(+24.3)#2,648 |
| 84. | Exeter | 27.3% | 41.7%(-14.4)#84 | 4.2%(+23.1)#2,723 |
| 85. | Klondike Corner | 27.1% | 41.7%(-14.6)#85 | 4.2%(+22.9)#2,743 |
| 86. | Bradford | 27.1% | 41.7%(-14.6)#86 | 4.2%(+22.9)#2,745 |
| 87. | Manchester | 26.6% | 41.7%(-15.1)#87 | 4.2%(+22.4)#2,785 |
| 88. | Blodgett Landing | 23.8% | 41.7%(-17.9)#88 | 4.2%(+19.6)#3,011 |
| 89. | Hampton | 22.8% | 41.7%(-18.9)#89 | 4.2%(+18.6)#3,083 |
| 90. | Henniker | 22.6% | 41.7%(-19.1)#90 | 4.2%(+18.4)#3,096 |
| 91. | Portsmouth | 21.9% | 41.7%(-19.8)#91 | 4.2%(+17.7)#3,168 |
| 92. | Mountain Lakes | 20.5% | 41.7%(-21.2)#92 | 4.2%(+16.3)#3,291 |
| 93. | East Merrimack | 20.0% | 41.7%(-21.7)#93 | 4.2%(+15.8)#3,339 |
| 94. | Concord | 18.1% | 41.7%(-23.6)#94 | 4.2%(+13.9)#3,536 |
| 95. | Loudon | 18.1% | 41.7%(-23.6)#95 | 4.2%(+13.9)#3,541 |
| 96. | Hudson | 17.9% | 41.7%(-23.8)#96 | 4.2%(+13.7)#3,557 |
| 97. | Hooksett | 17.3% | 41.7%(-24.4)#97 | 4.2%(+13.1)#3,614 |
| 98. | Nashua | 8.3% | 41.7%(-33.4)#98 | 4.2%(+4.10)#5,095 |
| 99. | Hampton Beach | 6.2% | 41.7%(-35.5)#99 | 4.2%(+2.00)#5,722 |
| 100. | Seabrook Beach | 0.40% | 41.7%(-41.3)#100 | 4.2%(-3.80)#11,011 |
1
Common Questions
What are the Top 10 Cities with the Highest Percentage of Households Heated by Fuel Oil / Kerosene in New Hampshire?
Top 10 Cities with the Highest Percentage of Households Heated by Fuel Oil / Kerosene in New Hampshire are:
#1
100.0%
#2
89.2%
#3
89.0%
#4
83.8%
#5
83.7%
#6
79.0%
#7
78.3%
#8
77.1%
#9
74.5%
#10
74.1%
What city has the Highest Percentage of Households Heated by Fuel Oil / Kerosene in New Hampshire?
Milton Mills has the Highest Percentage of Households Heated by Fuel Oil / Kerosene in New Hampshire with 100.0%.
What is the Percentage of Households Heated by Fuel Oil / Kerosene in the State of New Hampshire?
Percentage of Households Heated by Fuel Oil / Kerosene in New Hampshire is 41.7%.
What is the Percentage of Households Heated by Fuel Oil / Kerosene in the United States?
Percentage of Households Heated by Fuel Oil / Kerosene in the United States is 4.2%.