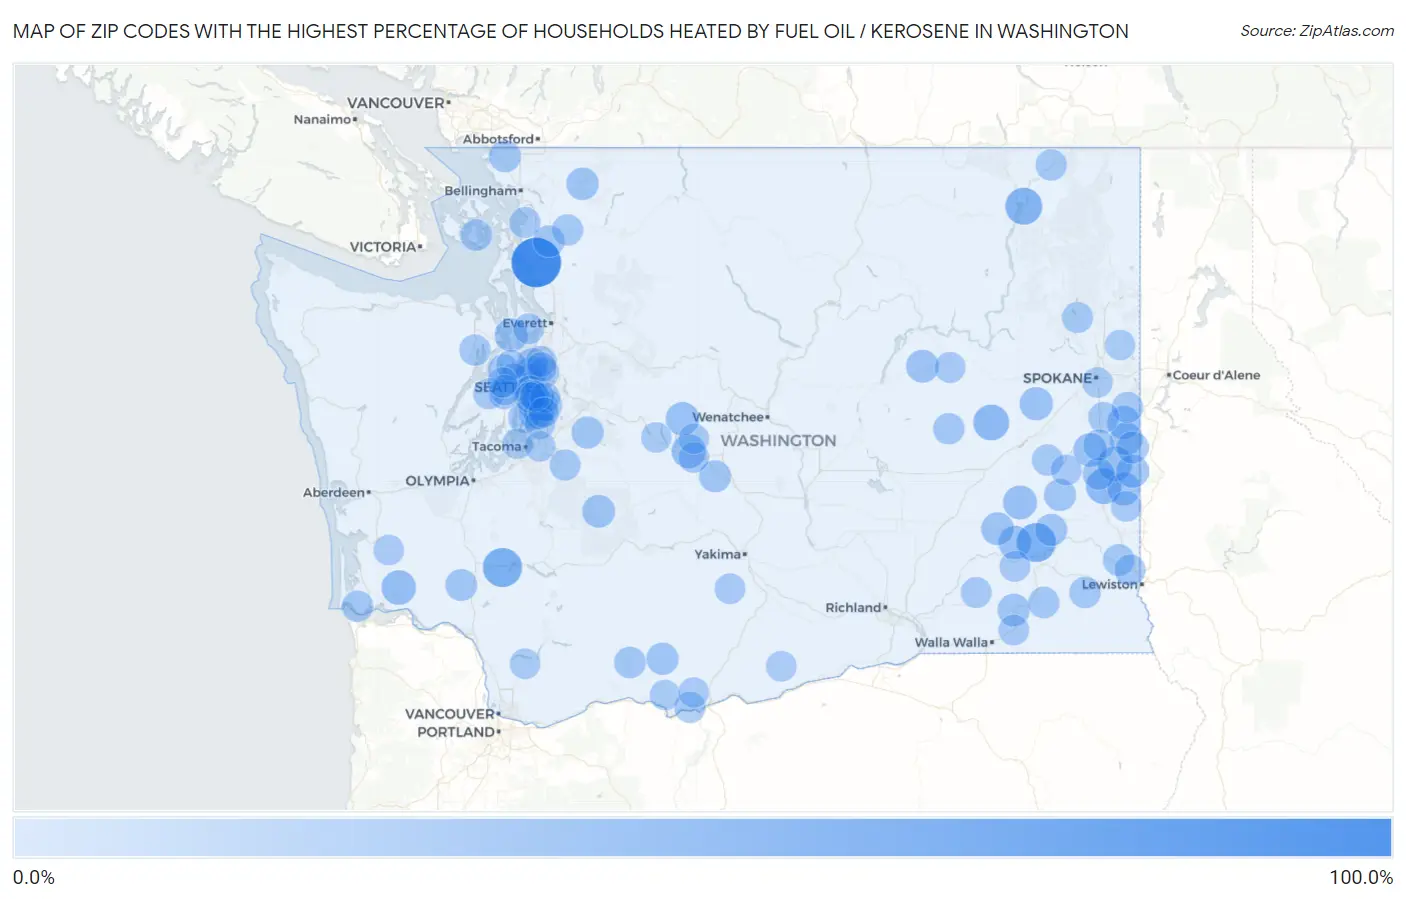
Zip Codes with the Highest Percentage of Households Heated by Fuel Oil / Kerosene in Washington
RELATED REPORTS & OPTIONS
Fuel Oil Heating
Washington
Compare Zip Codes
Map of Zip Codes with the Highest Percentage of Households Heated by Fuel Oil / Kerosene in Washington
0.0%
100.0%
Zip Codes with the Highest Percentage of Households Heated by Fuel Oil / Kerosene in Washington
| Zip Code | Fuel Oil Heating | vs State | vs National | |
| 1. | 98238 | 100.0% | 1.5%(+98.5)#1 | 4.2%(+95.8)#55 |
| 2. | 98582 | 46.8% | 1.5%(+45.3)#2 | 4.2%(+42.6)#2,064 |
| 3. | 99136 | 46.2% | 1.5%(+44.7)#3 | 4.2%(+42.0)#2,099 |
| 4. | 99151 | 35.4% | 1.5%(+33.9)#4 | 4.2%(+31.2)#2,918 |
| 5. | 99154 | 30.0% | 1.5%(+28.5)#5 | 4.2%(+25.8)#3,341 |
| 6. | 99174 | 29.4% | 1.5%(+27.9)#6 | 4.2%(+25.2)#3,380 |
| 7. | 98621 | 23.6% | 1.5%(+22.1)#7 | 4.2%(+19.4)#3,914 |
| 8. | 99158 | 23.4% | 1.5%(+21.9)#8 | 4.2%(+19.2)#3,933 |
| 9. | 98941 | 22.0% | 1.5%(+20.5)#9 | 4.2%(+17.8)#4,072 |
| 10. | 99105 | 20.0% | 1.5%(+18.5)#10 | 4.2%(+15.8)#4,291 |
| 11. | 99149 | 18.5% | 1.5%(+17.0)#11 | 4.2%(+14.3)#4,462 |
| 12. | 98940 | 18.1% | 1.5%(+16.6)#12 | 4.2%(+13.9)#4,505 |
| 13. | 99333 | 17.9% | 1.5%(+16.4)#13 | 4.2%(+13.7)#4,543 |
| 14. | 99008 | 17.6% | 1.5%(+16.1)#14 | 4.2%(+13.4)#4,578 |
| 15. | 99012 | 16.9% | 1.5%(+15.4)#15 | 4.2%(+12.7)#4,690 |
| 16. | 98340 | 16.7% | 1.5%(+15.2)#16 | 4.2%(+12.5)#4,720 |
| 17. | 99130 | 16.3% | 1.5%(+14.8)#17 | 4.2%(+12.1)#4,787 |
| 18. | 99128 | 16.2% | 1.5%(+14.7)#18 | 4.2%(+12.0)#4,802 |
| 19. | 98304 | 15.3% | 1.5%(+13.8)#19 | 4.2%(+11.1)#4,946 |
| 20. | 99103 | 15.3% | 1.5%(+13.8)#20 | 4.2%(+11.1)#4,947 |
| 21. | 99371 | 15.3% | 1.5%(+13.8)#21 | 4.2%(+11.1)#4,949 |
| 22. | 99018 | 15.3% | 1.5%(+13.8)#22 | 4.2%(+11.1)#4,950 |
| 23. | 99361 | 13.8% | 1.5%(+12.3)#23 | 4.2%(+9.60)#5,217 |
| 24. | 98244 | 13.7% | 1.5%(+12.2)#24 | 4.2%(+9.50)#5,228 |
| 25. | 98619 | 12.2% | 1.5%(+10.7)#25 | 4.2%(+8.00)#5,534 |
| 26. | 98051 | 12.0% | 1.5%(+10.5)#26 | 4.2%(+7.80)#5,573 |
| 27. | 99033 | 11.6% | 1.5%(+10.1)#27 | 4.2%(+7.40)#5,681 |
| 28. | 99143 | 11.6% | 1.5%(+10.1)#28 | 4.2%(+7.40)#5,683 |
| 29. | 99125 | 11.6% | 1.5%(+10.1)#29 | 4.2%(+7.40)#5,685 |
| 30. | 99176 | 11.3% | 1.5%(+9.80)#30 | 4.2%(+7.10)#5,759 |
| 31. | 98946 | 10.6% | 1.5%(+9.10)#31 | 4.2%(+6.40)#5,936 |
| 32. | 98240 | 10.4% | 1.5%(+8.90)#32 | 4.2%(+6.20)#5,969 |
| 33. | 98593 | 10.4% | 1.5%(+8.90)#33 | 4.2%(+6.20)#5,972 |
| 34. | 98235 | 10.3% | 1.5%(+8.80)#34 | 4.2%(+6.10)#5,997 |
| 35. | 99113 | 9.9% | 1.5%(+8.40)#35 | 4.2%(+5.70)#6,102 |
| 36. | 98650 | 9.8% | 1.5%(+8.30)#36 | 4.2%(+5.60)#6,128 |
| 37. | 98117 | 9.5% | 1.5%(+8.00)#37 | 4.2%(+5.30)#6,201 |
| 38. | 98166 | 9.5% | 1.5%(+8.00)#38 | 4.2%(+5.30)#6,202 |
| 39. | 98178 | 9.3% | 1.5%(+7.80)#39 | 4.2%(+5.10)#6,258 |
| 40. | 98261 | 8.9% | 1.5%(+7.40)#40 | 4.2%(+4.70)#6,384 |
| 41. | 99347 | 8.9% | 1.5%(+7.40)#41 | 4.2%(+4.70)#6,386 |
| 42. | 99328 | 8.4% | 1.5%(+6.90)#42 | 4.2%(+4.20)#6,544 |
| 43. | 98345 | 8.4% | 1.5%(+6.90)#43 | 4.2%(+4.20)#6,568 |
| 44. | 99159 | 8.3% | 1.5%(+6.80)#44 | 4.2%(+4.10)#6,597 |
| 45. | 98614 | 8.3% | 1.5%(+6.80)#45 | 4.2%(+4.10)#6,605 |
| 46. | 98146 | 8.1% | 1.5%(+6.60)#46 | 4.2%(+3.90)#6,664 |
| 47. | 98177 | 7.8% | 1.5%(+6.30)#47 | 4.2%(+3.60)#6,781 |
| 48. | 98263 | 7.8% | 1.5%(+6.30)#48 | 4.2%(+3.60)#6,811 |
| 49. | 98070 | 7.6% | 1.5%(+6.10)#49 | 4.2%(+3.40)#6,866 |
| 50. | 99017 | 7.6% | 1.5%(+6.10)#50 | 4.2%(+3.40)#6,901 |
| 51. | 98168 | 7.5% | 1.5%(+6.00)#51 | 4.2%(+3.30)#6,907 |
| 52. | 98376 | 7.5% | 1.5%(+6.00)#52 | 4.2%(+3.30)#6,926 |
| 53. | 99030 | 7.5% | 1.5%(+6.00)#53 | 4.2%(+3.30)#6,939 |
| 54. | 98199 | 7.4% | 1.5%(+5.90)#54 | 4.2%(+3.20)#6,952 |
| 55. | 99157 | 7.1% | 1.5%(+5.60)#55 | 4.2%(+2.90)#7,085 |
| 56. | 98115 | 7.0% | 1.5%(+5.50)#56 | 4.2%(+2.80)#7,107 |
| 57. | 99031 | 6.9% | 1.5%(+5.40)#57 | 4.2%(+2.70)#7,164 |
| 58. | 98110 | 6.8% | 1.5%(+5.30)#58 | 4.2%(+2.60)#7,188 |
| 59. | 98673 | 6.8% | 1.5%(+5.30)#59 | 4.2%(+2.60)#7,212 |
| 60. | 99170 | 6.6% | 1.5%(+5.10)#60 | 4.2%(+2.40)#7,312 |
| 61. | 99179 | 6.6% | 1.5%(+5.10)#61 | 4.2%(+2.40)#7,319 |
| 62. | 98385 | 6.6% | 1.5%(+5.10)#62 | 4.2%(+2.40)#7,321 |
| 63. | 98312 | 6.4% | 1.5%(+4.90)#63 | 4.2%(+2.20)#7,368 |
| 64. | 99110 | 6.3% | 1.5%(+4.80)#64 | 4.2%(+2.10)#7,449 |
| 65. | 98232 | 6.1% | 1.5%(+4.60)#65 | 4.2%(+1.90)#7,538 |
| 66. | 99348 | 6.1% | 1.5%(+4.60)#66 | 4.2%(+1.90)#7,548 |
| 67. | 98116 | 6.0% | 1.5%(+4.50)#67 | 4.2%(+1.80)#7,563 |
| 68. | 99171 | 6.0% | 1.5%(+4.50)#68 | 4.2%(+1.80)#7,591 |
| 69. | 98108 | 5.9% | 1.5%(+4.40)#69 | 4.2%(+1.70)#7,614 |
| 70. | 98155 | 5.7% | 1.5%(+4.20)#70 | 4.2%(+1.50)#7,710 |
| 71. | 99185 | 5.7% | 1.5%(+4.20)#71 | 4.2%(+1.50)#7,752 |
| 72. | 99359 | 5.6% | 1.5%(+4.10)#72 | 4.2%(+1.40)#7,820 |
| 73. | 98337 | 5.4% | 1.5%(+3.90)#73 | 4.2%(+1.20)#7,895 |
| 74. | 98126 | 5.2% | 1.5%(+3.70)#74 | 4.2%(+1.00)#7,998 |
| 75. | 98125 | 5.1% | 1.5%(+3.60)#75 | 4.2%(+0.900)#8,055 |
| 76. | 98148 | 4.9% | 1.5%(+3.40)#76 | 4.2%(+0.700)#8,165 |
| 77. | 99161 | 4.8% | 1.5%(+3.30)#77 | 4.2%(+0.600)#8,263 |
| 78. | 98236 | 4.7% | 1.5%(+3.20)#78 | 4.2%(+0.500)#8,305 |
| 79. | 98933 | 4.6% | 1.5%(+3.10)#79 | 4.2%(+0.400)#8,407 |
| 80. | 98943 | 4.6% | 1.5%(+3.10)#80 | 4.2%(+0.400)#8,418 |
| 81. | 99329 | 4.6% | 1.5%(+3.10)#81 | 4.2%(+0.400)#8,430 |
| 82. | 98136 | 4.4% | 1.5%(+2.90)#82 | 4.2%(+0.200)#8,493 |
| 83. | 98601 | 4.3% | 1.5%(+2.80)#83 | 4.2%(+0.100)#8,582 |
| 84. | 98577 | 4.2% | 1.5%(+2.70)#84 | 4.2%(=0.000)#8,652 |
| 85. | 98406 | 4.1% | 1.5%(+2.60)#85 | 4.2%(-0.100)#8,713 |
| 86. | 99322 | 4.1% | 1.5%(+2.60)#86 | 4.2%(-0.100)#8,775 |
| 87. | 98392 | 4.0% | 1.5%(+2.50)#87 | 4.2%(-0.200)#8,820 |
| 88. | 98922 | 3.9% | 1.5%(+2.40)#88 | 4.2%(-0.300)#8,868 |
| 89. | 98118 | 3.8% | 1.5%(+2.30)#89 | 4.2%(-0.400)#8,924 |
| 90. | 98310 | 3.8% | 1.5%(+2.30)#90 | 4.2%(-0.400)#8,934 |
| 91. | 98198 | 3.7% | 1.5%(+2.20)#91 | 4.2%(-0.500)#9,026 |
| 92. | 98106 | 3.7% | 1.5%(+2.20)#92 | 4.2%(-0.500)#9,032 |
| 93. | 99203 | 3.7% | 1.5%(+2.20)#93 | 4.2%(-0.500)#9,036 |
| 94. | 98354 | 3.7% | 1.5%(+2.20)#94 | 4.2%(-0.500)#9,052 |
| 95. | 98925 | 3.7% | 1.5%(+2.20)#95 | 4.2%(-0.500)#9,093 |
| 96. | 98311 | 3.6% | 1.5%(+2.10)#96 | 4.2%(-0.600)#9,115 |
| 97. | 98635 | 3.6% | 1.5%(+2.10)#97 | 4.2%(-0.600)#9,157 |
| 98. | 98188 | 3.4% | 1.5%(+1.90)#98 | 4.2%(-0.800)#9,299 |
| 99. | 99021 | 3.4% | 1.5%(+1.90)#99 | 4.2%(-0.800)#9,310 |
| 100. | 98613 | 3.4% | 1.5%(+1.90)#100 | 4.2%(-0.800)#9,376 |
Common Questions
What are the Top 10 Zip Codes with the Highest Percentage of Households Heated by Fuel Oil / Kerosene in Washington?
Top 10 Zip Codes with the Highest Percentage of Households Heated by Fuel Oil / Kerosene in Washington are:
What zip code has the Highest Percentage of Households Heated by Fuel Oil / Kerosene in Washington?
98238 has the Highest Percentage of Households Heated by Fuel Oil / Kerosene in Washington with 100.0%.
What is the Percentage of Households Heated by Fuel Oil / Kerosene in the State of Washington?
Percentage of Households Heated by Fuel Oil / Kerosene in Washington is 1.5%.
What is the Percentage of Households Heated by Fuel Oil / Kerosene in the United States?
Percentage of Households Heated by Fuel Oil / Kerosene in the United States is 4.2%.