Cities with the Most Immigrants from Latin America in New Mexico
RELATED REPORTS & OPTIONS
Latin America
New Mexico
Compare Cities
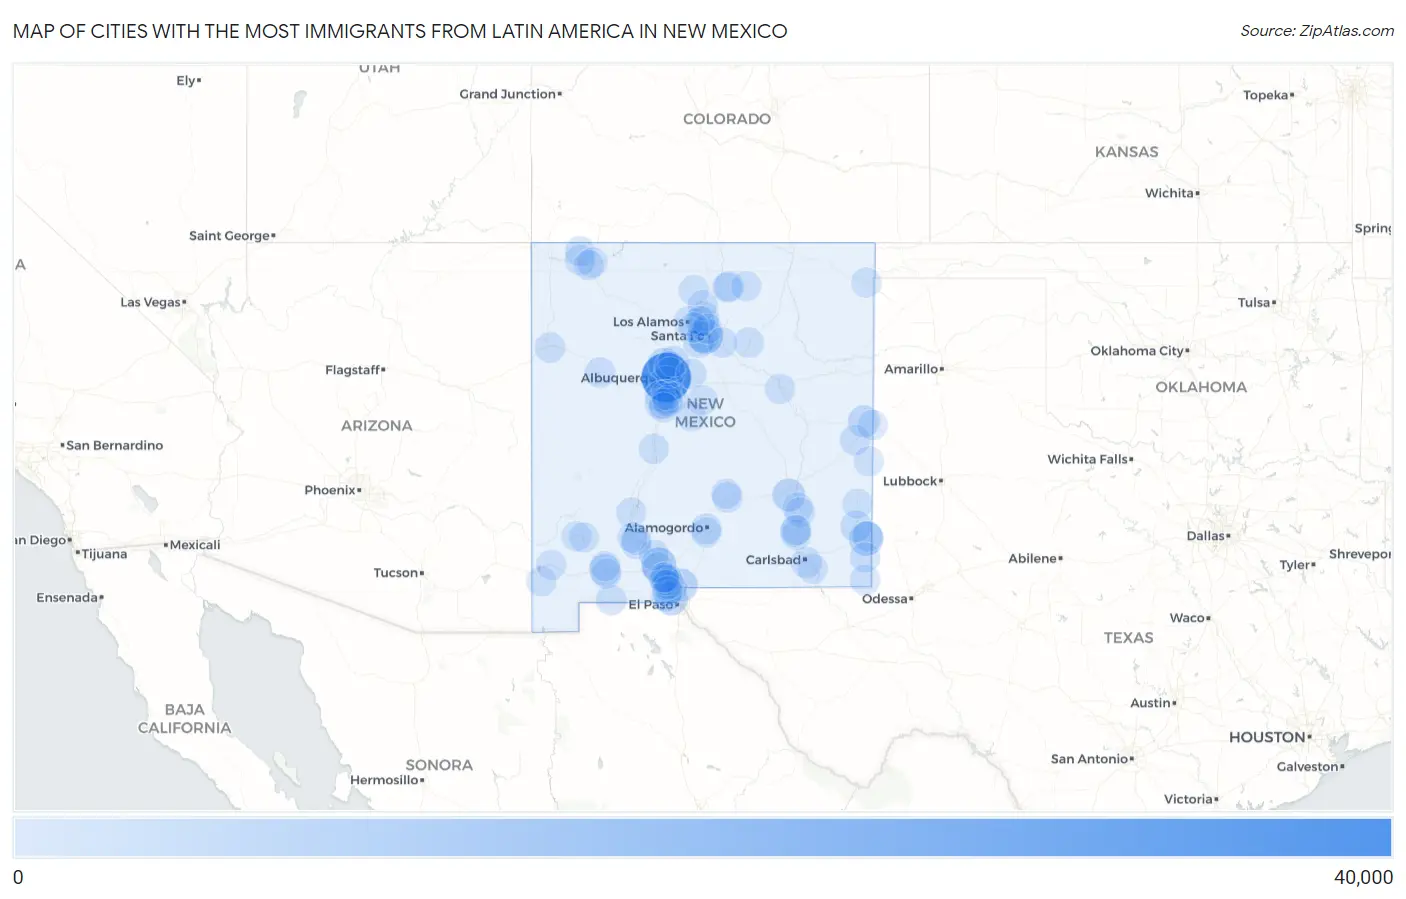
Map of Cities with the Most Immigrants from Latin America in New Mexico
0
40,000
Cities with the Most Immigrants from Latin America in New Mexico
| City | Latin America | vs State | vs National | |
| 1. | Albuquerque | 34,674 | 144,410(24.01%)#1 | 22,649,518(0.15%)#74 |
| 2. | Santa Fe | 9,598 | 144,410(6.65%)#2 | 22,649,518(0.04%)#348 |
| 3. | Las Cruces | 8,390 | 144,410(5.81%)#3 | 22,649,518(0.04%)#401 |
| 4. | Hobbs | 6,638 | 144,410(4.60%)#4 | 22,649,518(0.03%)#509 |
| 5. | South Valley | 5,226 | 144,410(3.62%)#5 | 22,649,518(0.02%)#649 |
| 6. | Sunland Park | 5,093 | 144,410(3.53%)#6 | 22,649,518(0.02%)#666 |
| 7. | Chaparral | 4,593 | 144,410(3.18%)#7 | 22,649,518(0.02%)#719 |
| 8. | Roswell | 4,568 | 144,410(3.16%)#8 | 22,649,518(0.02%)#721 |
| 9. | Anthony | 3,052 | 144,410(2.11%)#9 | 22,649,518(0.01%)#988 |
| 10. | Rio Rancho | 2,967 | 144,410(2.05%)#10 | 22,649,518(0.01%)#1,014 |
| 11. | Clovis | 2,929 | 144,410(2.03%)#11 | 22,649,518(0.01%)#1,023 |
| 12. | Deming | 2,665 | 144,410(1.85%)#12 | 22,649,518(0.01%)#1,094 |
| 13. | Lovington | 2,124 | 144,410(1.47%)#13 | 22,649,518(0.01%)#1,291 |
| 14. | Carlsbad | 1,404 | 144,410(0.97%)#14 | 22,649,518(0.01%)#1,701 |
| 15. | El Cerro Mission | 1,289 | 144,410(0.89%)#15 | 22,649,518(0.01%)#1,814 |
| 16. | Bernalillo | 1,259 | 144,410(0.87%)#16 | 22,649,518(0.01%)#1,842 |
| 17. | Espanola | 1,169 | 144,410(0.81%)#17 | 22,649,518(0.01%)#1,941 |
| 18. | Santa Teresa | 1,087 | 144,410(0.75%)#18 | 22,649,518(0.00%)#2,032 |
| 19. | La Cienega | 1,009 | 144,410(0.70%)#19 | 22,649,518(0.00%)#2,130 |
| 20. | Vado | 1,001 | 144,410(0.69%)#20 | 22,649,518(0.00%)#2,142 |
| 21. | Artesia | 974 | 144,410(0.67%)#21 | 22,649,518(0.00%)#2,182 |
| 22. | Meadow Lake | 845 | 144,410(0.59%)#22 | 22,649,518(0.00%)#2,375 |
| 23. | Farmington | 791 | 144,410(0.55%)#23 | 22,649,518(0.00%)#2,484 |
| 24. | North Hobbs | 790 | 144,410(0.55%)#24 | 22,649,518(0.00%)#2,485 |
| 25. | Gallup | 785 | 144,410(0.54%)#25 | 22,649,518(0.00%)#2,496 |
| 26. | Alamogordo | 766 | 144,410(0.53%)#26 | 22,649,518(0.00%)#2,532 |
| 27. | Portales | 611 | 144,410(0.42%)#27 | 22,649,518(0.00%)#2,896 |
| 28. | North Valley | 611 | 144,410(0.42%)#28 | 22,649,518(0.00%)#2,897 |
| 29. | Belen | 597 | 144,410(0.41%)#29 | 22,649,518(0.00%)#2,941 |
| 30. | Grants | 589 | 144,410(0.41%)#30 | 22,649,518(0.00%)#2,965 |
| 31. | Hatch | 540 | 144,410(0.37%)#31 | 22,649,518(0.00%)#3,134 |
| 32. | Agua Fria | 531 | 144,410(0.37%)#32 | 22,649,518(0.00%)#3,177 |
| 33. | Berino | 488 | 144,410(0.34%)#33 | 22,649,518(0.00%)#3,330 |
| 34. | Columbus | 472 | 144,410(0.33%)#34 | 22,649,518(0.00%)#3,399 |
| 35. | Taos | 470 | 144,410(0.33%)#35 | 22,649,518(0.00%)#3,407 |
| 36. | Jal | 455 | 144,410(0.32%)#36 | 22,649,518(0.00%)#3,456 |
| 37. | Los Lunas | 450 | 144,410(0.31%)#37 | 22,649,518(0.00%)#3,480 |
| 38. | Salem | 443 | 144,410(0.31%)#38 | 22,649,518(0.00%)#3,516 |
| 39. | Socorro | 379 | 144,410(0.26%)#39 | 22,649,518(0.00%)#3,833 |
| 40. | Corrales | 372 | 144,410(0.26%)#40 | 22,649,518(0.00%)#3,880 |
| 41. | Dona Ana | 366 | 144,410(0.25%)#41 | 22,649,518(0.00%)#3,921 |
| 42. | Crouch Mesa | 341 | 144,410(0.24%)#42 | 22,649,518(0.00%)#4,076 |
| 43. | Eunice | 316 | 144,410(0.22%)#43 | 22,649,518(0.00%)#4,226 |
| 44. | Edgewood | 311 | 144,410(0.22%)#44 | 22,649,518(0.00%)#4,253 |
| 45. | Ruidoso Downs | 298 | 144,410(0.21%)#45 | 22,649,518(0.00%)#4,346 |
| 46. | Mesquite | 278 | 144,410(0.19%)#46 | 22,649,518(0.00%)#4,495 |
| 47. | Valle Vista | 258 | 144,410(0.18%)#47 | 22,649,518(0.00%)#4,640 |
| 48. | Angustura | 256 | 144,410(0.18%)#48 | 22,649,518(0.00%)#4,655 |
| 49. | El Valle De Arroyo Seco | 248 | 144,410(0.17%)#49 | 22,649,518(0.00%)#4,723 |
| 50. | El Rito | 234 | 144,410(0.16%)#50 | 22,649,518(0.00%)#4,862 |
| 51. | Las Vegas | 233 | 144,410(0.16%)#51 | 22,649,518(0.00%)#4,868 |
| 52. | Canada De Los Alamos | 231 | 144,410(0.16%)#52 | 22,649,518(0.00%)#4,896 |
| 53. | Dexter | 230 | 144,410(0.16%)#53 | 22,649,518(0.00%)#4,908 |
| 54. | Pojoaque | 222 | 144,410(0.15%)#54 | 22,649,518(0.00%)#4,985 |
| 55. | Ruidoso | 216 | 144,410(0.15%)#55 | 22,649,518(0.00%)#5,044 |
| 56. | La Mesa | 206 | 144,410(0.14%)#56 | 22,649,518(0.00%)#5,170 |
| 57. | Silver City | 201 | 144,410(0.14%)#57 | 22,649,518(0.00%)#5,217 |
| 58. | Boles Acres | 197 | 144,410(0.14%)#58 | 22,649,518(0.00%)#5,265 |
| 59. | Atoka | 189 | 144,410(0.13%)#59 | 22,649,518(0.00%)#5,379 |
| 60. | Texico | 188 | 144,410(0.13%)#60 | 22,649,518(0.00%)#5,393 |
| 61. | Gamerco | 179 | 144,410(0.12%)#61 | 22,649,518(0.00%)#5,509 |
| 62. | Los Alamos | 178 | 144,410(0.12%)#62 | 22,649,518(0.00%)#5,515 |
| 63. | Santa Rosa | 175 | 144,410(0.12%)#63 | 22,649,518(0.00%)#5,580 |
| 64. | Ranchos De Taos | 171 | 144,410(0.12%)#64 | 22,649,518(0.00%)#5,645 |
| 65. | Williamsburg | 169 | 144,410(0.12%)#65 | 22,649,518(0.00%)#5,684 |
| 66. | Estancia | 164 | 144,410(0.11%)#66 | 22,649,518(0.00%)#5,777 |
| 67. | La Hacienda | 161 | 144,410(0.11%)#67 | 22,649,518(0.00%)#5,823 |
| 68. | La Plata | 152 | 144,410(0.11%)#68 | 22,649,518(0.00%)#5,959 |
| 69. | Bayard | 144 | 144,410(0.10%)#69 | 22,649,518(0.00%)#6,100 |
| 70. | Fairacres | 141 | 144,410(0.10%)#70 | 22,649,518(0.00%)#6,156 |
| 71. | Bloomfield | 140 | 144,410(0.10%)#71 | 22,649,518(0.00%)#6,166 |
| 72. | West Hammond | 140 | 144,410(0.10%)#72 | 22,649,518(0.00%)#6,172 |
| 73. | Chamberino | 139 | 144,410(0.10%)#73 | 22,649,518(0.00%)#6,194 |
| 74. | Angel Fire | 138 | 144,410(0.10%)#74 | 22,649,518(0.00%)#6,212 |
| 75. | Williams Acres | 136 | 144,410(0.09%)#75 | 22,649,518(0.00%)#6,249 |
| 76. | Keeler Farm | 132 | 144,410(0.09%)#76 | 22,649,518(0.00%)#6,313 |
| 77. | Radium Springs | 129 | 144,410(0.09%)#77 | 22,649,518(0.00%)#6,376 |
| 78. | Adelino | 124 | 144,410(0.09%)#78 | 22,649,518(0.00%)#6,480 |
| 79. | Los Luceros | 123 | 144,410(0.09%)#79 | 22,649,518(0.00%)#6,498 |
| 80. | Monterey Park | 122 | 144,410(0.08%)#80 | 22,649,518(0.00%)#6,520 |
| 81. | Cotton City | 112 | 144,410(0.08%)#81 | 22,649,518(0.00%)#6,754 |
| 82. | Lordsburg | 110 | 144,410(0.08%)#82 | 22,649,518(0.00%)#6,790 |
| 83. | Loving | 108 | 144,410(0.07%)#83 | 22,649,518(0.00%)#6,836 |
| 84. | Peak Place | 108 | 144,410(0.07%)#84 | 22,649,518(0.00%)#6,843 |
| 85. | Peralta | 105 | 144,410(0.07%)#85 | 22,649,518(0.00%)#6,910 |
| 86. | La Union | 100 | 144,410(0.07%)#86 | 22,649,518(0.00%)#7,040 |
| 87. | Tatum | 99 | 144,410(0.07%)#87 | 22,649,518(0.00%)#7,069 |
| 88. | El Rancho | 98 | 144,410(0.07%)#88 | 22,649,518(0.00%)#7,092 |
| 89. | Clayton | 91 | 144,410(0.06%)#89 | 22,649,518(0.00%)#7,287 |
| 90. | Hagerman | 85 | 144,410(0.06%)#90 | 22,649,518(0.00%)#7,488 |
| 91. | White Rock | 84 | 144,410(0.06%)#91 | 22,649,518(0.00%)#7,506 |
| 92. | Causey | 84 | 144,410(0.06%)#92 | 22,649,518(0.00%)#7,535 |
| 93. | San Miguel | 82 | 144,410(0.06%)#93 | 22,649,518(0.00%)#7,597 |
| 94. | Morningside | 82 | 144,410(0.06%)#94 | 22,649,518(0.00%)#7,598 |
| 95. | Mountainair | 78 | 144,410(0.05%)#95 | 22,649,518(0.00%)#7,725 |
| 96. | Garfield | 77 | 144,410(0.05%)#96 | 22,649,518(0.00%)#7,765 |
| 97. | Placitas Cdp Dona Ana County | 76 | 144,410(0.05%)#97 | 22,649,518(0.00%)#7,799 |
| 98. | Rio Communities | 73 | 144,410(0.05%)#98 | 22,649,518(0.00%)#7,876 |
| 99. | Butterfield Park | 73 | 144,410(0.05%)#99 | 22,649,518(0.00%)#7,902 |
| 100. | Pecos | 72 | 144,410(0.05%)#100 | 22,649,518(0.00%)#7,937 |
Common Questions
What are the Top 10 Cities with the Most Immigrants from Latin America in New Mexico?
Top 10 Cities with the Most Immigrants from Latin America in New Mexico are:
#1
34,674
#2
9,598
#3
8,390
#4
6,638
#5
5,226
#6
5,093
#7
4,593
#8
4,568
#9
3,052
#10
2,967
What city has the Most Immigrants from Latin America in New Mexico?
Albuquerque has the Most Immigrants from Latin America in New Mexico with 34,674.
What is the Total Immigrants from Latin America in the State of New Mexico?
Total Immigrants from Latin America in New Mexico is 144,410.
What is the Total Immigrants from Latin America in the United States?
Total Immigrants from Latin America in the United States is 22,649,518.