Cities with the Most Immigrants from Latin America in Colorado
RELATED REPORTS & OPTIONS
Latin America
Colorado
Compare Cities
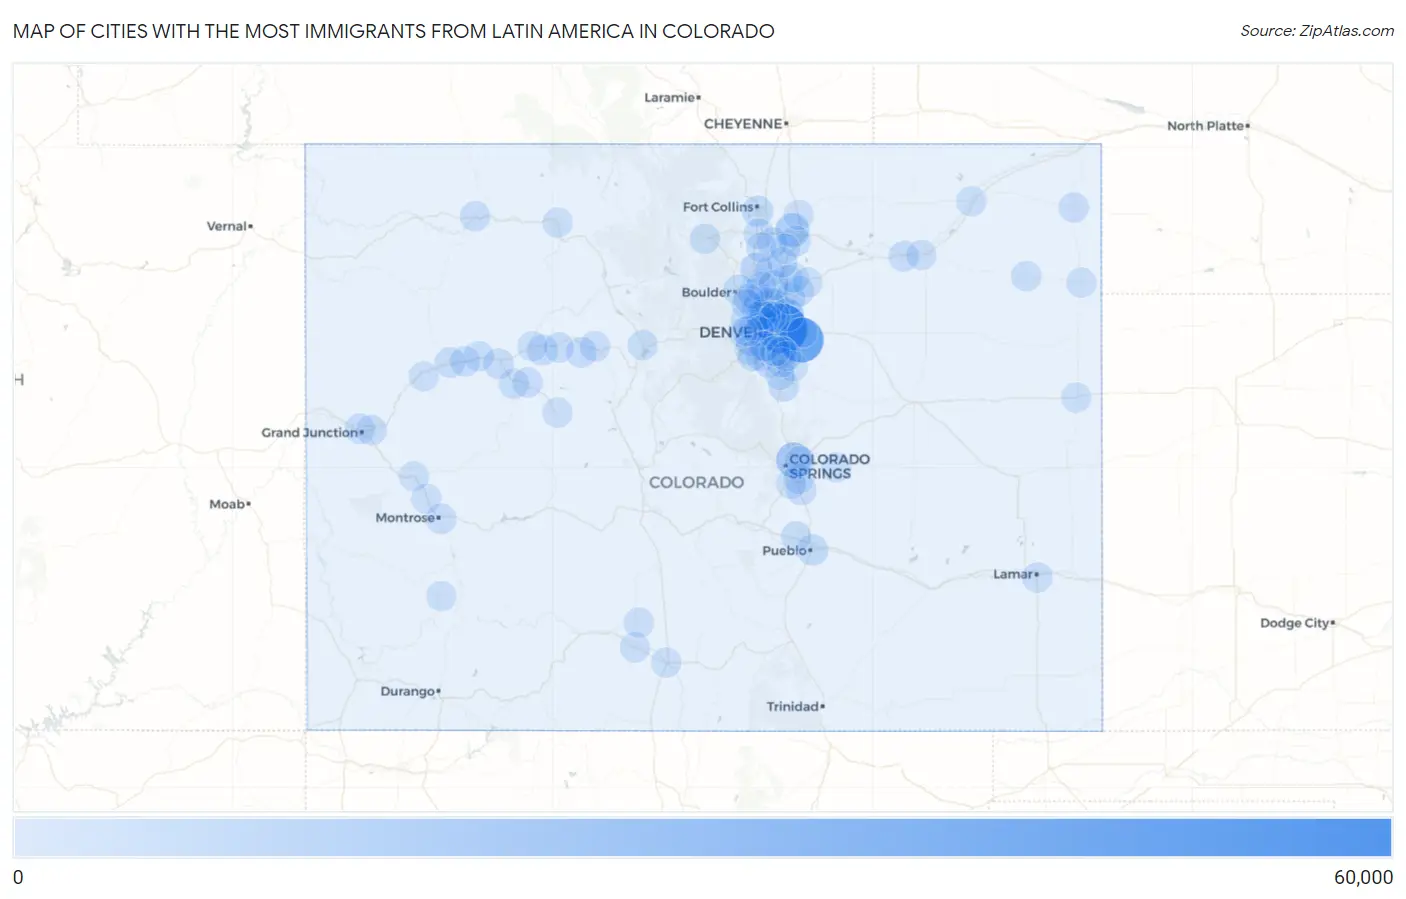
Map of Cities with the Most Immigrants from Latin America in Colorado
0
60,000
Cities with the Most Immigrants from Latin America in Colorado
| City | Latin America | vs State | vs National | |
| 1. | Denver | 55,331 | 276,863(19.98%)#1 | 22,649,518(0.24%)#28 |
| 2. | Aurora | 41,520 | 276,863(15.00%)#2 | 22,649,518(0.18%)#51 |
| 3. | Colorado Springs | 14,771 | 276,863(5.34%)#3 | 22,649,518(0.07%)#225 |
| 4. | Thornton | 12,740 | 276,863(4.60%)#4 | 22,649,518(0.06%)#259 |
| 5. | Greeley | 10,392 | 276,863(3.75%)#5 | 22,649,518(0.05%)#322 |
| 6. | Commerce City | 7,969 | 276,863(2.88%)#6 | 22,649,518(0.04%)#420 |
| 7. | Lakewood | 5,871 | 276,863(2.12%)#7 | 22,649,518(0.03%)#569 |
| 8. | Longmont | 5,266 | 276,863(1.90%)#8 | 22,649,518(0.02%)#642 |
| 9. | Westminster | 4,230 | 276,863(1.53%)#9 | 22,649,518(0.02%)#763 |
| 10. | Fort Collins | 4,091 | 276,863(1.48%)#10 | 22,649,518(0.02%)#782 |
| 11. | Welby | 3,322 | 276,863(1.20%)#11 | 22,649,518(0.01%)#923 |
| 12. | Sherrelwood | 3,173 | 276,863(1.15%)#12 | 22,649,518(0.01%)#957 |
| 13. | Pueblo | 3,083 | 276,863(1.11%)#13 | 22,649,518(0.01%)#980 |
| 14. | Evans | 3,034 | 276,863(1.10%)#14 | 22,649,518(0.01%)#994 |
| 15. | Federal Heights | 2,678 | 276,863(0.97%)#15 | 22,649,518(0.01%)#1,089 |
| 16. | Brighton | 2,646 | 276,863(0.96%)#16 | 22,649,518(0.01%)#1,099 |
| 17. | Boulder | 2,514 | 276,863(0.91%)#17 | 22,649,518(0.01%)#1,143 |
| 18. | Broomfield | 2,193 | 276,863(0.79%)#18 | 22,649,518(0.01%)#1,247 |
| 19. | Northglenn | 2,182 | 276,863(0.79%)#19 | 22,649,518(0.01%)#1,256 |
| 20. | Centennial | 2,066 | 276,863(0.75%)#20 | 22,649,518(0.01%)#1,314 |
| 21. | Castle Rock | 1,978 | 276,863(0.71%)#21 | 22,649,518(0.01%)#1,354 |
| 22. | Arvada | 1,842 | 276,863(0.67%)#22 | 22,649,518(0.01%)#1,424 |
| 23. | Gypsum | 1,836 | 276,863(0.66%)#23 | 22,649,518(0.01%)#1,427 |
| 24. | Berkley | 1,830 | 276,863(0.66%)#24 | 22,649,518(0.01%)#1,429 |
| 25. | Derby | 1,729 | 276,863(0.62%)#25 | 22,649,518(0.01%)#1,484 |
| 26. | Fort Morgan | 1,697 | 276,863(0.61%)#26 | 22,649,518(0.01%)#1,502 |
| 27. | Edwards | 1,688 | 276,863(0.61%)#27 | 22,649,518(0.01%)#1,507 |
| 28. | Glenwood Springs | 1,462 | 276,863(0.53%)#28 | 22,649,518(0.01%)#1,653 |
| 29. | Highlands Ranch | 1,445 | 276,863(0.52%)#29 | 22,649,518(0.01%)#1,664 |
| 30. | Loveland | 1,399 | 276,863(0.51%)#30 | 22,649,518(0.01%)#1,706 |
| 31. | Rifle | 1,386 | 276,863(0.50%)#31 | 22,649,518(0.01%)#1,724 |
| 32. | Lafayette | 1,350 | 276,863(0.49%)#32 | 22,649,518(0.01%)#1,752 |
| 33. | Twin Lakes Cdp Adams County | 1,260 | 276,863(0.46%)#33 | 22,649,518(0.01%)#1,839 |
| 34. | Grand Junction | 1,244 | 276,863(0.45%)#34 | 22,649,518(0.01%)#1,855 |
| 35. | Fort Lupton | 1,219 | 276,863(0.44%)#35 | 22,649,518(0.01%)#1,885 |
| 36. | Littleton | 1,206 | 276,863(0.44%)#36 | 22,649,518(0.01%)#1,898 |
| 37. | Englewood | 1,202 | 276,863(0.43%)#37 | 22,649,518(0.01%)#1,906 |
| 38. | Montrose | 1,112 | 276,863(0.40%)#38 | 22,649,518(0.00%)#1,996 |
| 39. | Fountain | 1,107 | 276,863(0.40%)#39 | 22,649,518(0.00%)#2,005 |
| 40. | Parker | 1,054 | 276,863(0.38%)#40 | 22,649,518(0.00%)#2,069 |
| 41. | Avon | 946 | 276,863(0.34%)#41 | 22,649,518(0.00%)#2,228 |
| 42. | Lochbuie | 934 | 276,863(0.34%)#42 | 22,649,518(0.00%)#2,251 |
| 43. | Security Widefield | 926 | 276,863(0.33%)#43 | 22,649,518(0.00%)#2,258 |
| 44. | Clifton | 884 | 276,863(0.32%)#44 | 22,649,518(0.00%)#2,313 |
| 45. | Firestone | 832 | 276,863(0.30%)#45 | 22,649,518(0.00%)#2,396 |
| 46. | Yuma | 819 | 276,863(0.30%)#46 | 22,649,518(0.00%)#2,422 |
| 47. | Four Square Mile | 803 | 276,863(0.29%)#47 | 22,649,518(0.00%)#2,457 |
| 48. | Pueblo West | 765 | 276,863(0.28%)#48 | 22,649,518(0.00%)#2,534 |
| 49. | New Castle | 760 | 276,863(0.27%)#49 | 22,649,518(0.00%)#2,554 |
| 50. | Carbondale | 707 | 276,863(0.26%)#50 | 22,649,518(0.00%)#2,669 |
| 51. | Cimarron Hills | 689 | 276,863(0.25%)#51 | 22,649,518(0.00%)#2,711 |
| 52. | Eagle | 682 | 276,863(0.25%)#52 | 22,649,518(0.00%)#2,728 |
| 53. | Silt | 674 | 276,863(0.24%)#53 | 22,649,518(0.00%)#2,745 |
| 54. | Shaw Heights | 651 | 276,863(0.24%)#54 | 22,649,518(0.00%)#2,791 |
| 55. | El Jebel | 644 | 276,863(0.23%)#55 | 22,649,518(0.00%)#2,809 |
| 56. | Lamar | 589 | 276,863(0.21%)#56 | 22,649,518(0.00%)#2,966 |
| 57. | Dakota Ridge | 572 | 276,863(0.21%)#57 | 22,649,518(0.00%)#3,032 |
| 58. | Craig | 558 | 276,863(0.20%)#58 | 22,649,518(0.00%)#3,073 |
| 59. | Johnstown | 555 | 276,863(0.20%)#59 | 22,649,518(0.00%)#3,082 |
| 60. | Holyoke | 501 | 276,863(0.18%)#60 | 22,649,518(0.00%)#3,274 |
| 61. | Estes Park | 487 | 276,863(0.18%)#61 | 22,649,518(0.00%)#3,337 |
| 62. | Silverthorne | 478 | 276,863(0.17%)#62 | 22,649,518(0.00%)#3,373 |
| 63. | Dacono | 466 | 276,863(0.17%)#63 | 22,649,518(0.00%)#3,421 |
| 64. | Battlement Mesa | 448 | 276,863(0.16%)#64 | 22,649,518(0.00%)#3,493 |
| 65. | Wheat Ridge | 443 | 276,863(0.16%)#65 | 22,649,518(0.00%)#3,511 |
| 66. | Dotsero | 441 | 276,863(0.16%)#66 | 22,649,518(0.00%)#3,528 |
| 67. | Steamboat Springs | 440 | 276,863(0.16%)#67 | 22,649,518(0.00%)#3,531 |
| 68. | Edgewater | 438 | 276,863(0.16%)#68 | 22,649,518(0.00%)#3,543 |
| 69. | Olathe | 428 | 276,863(0.15%)#69 | 22,649,518(0.00%)#3,594 |
| 70. | Aristocrat Ranchettes | 425 | 276,863(0.15%)#70 | 22,649,518(0.00%)#3,609 |
| 71. | Aspen | 390 | 276,863(0.14%)#71 | 22,649,518(0.00%)#3,778 |
| 72. | Erie | 382 | 276,863(0.14%)#72 | 22,649,518(0.00%)#3,809 |
| 73. | Sterling | 369 | 276,863(0.13%)#73 | 22,649,518(0.00%)#3,900 |
| 74. | Hudson | 361 | 276,863(0.13%)#74 | 22,649,518(0.00%)#3,946 |
| 75. | Golden | 360 | 276,863(0.13%)#75 | 22,649,518(0.00%)#3,949 |
| 76. | Sheridan | 357 | 276,863(0.13%)#76 | 22,649,518(0.00%)#3,966 |
| 77. | Aetna Estates | 355 | 276,863(0.13%)#77 | 22,649,518(0.00%)#3,976 |
| 78. | Ken Caryl | 354 | 276,863(0.13%)#78 | 22,649,518(0.00%)#3,977 |
| 79. | Louisville | 353 | 276,863(0.13%)#79 | 22,649,518(0.00%)#3,986 |
| 80. | Delta | 336 | 276,863(0.12%)#80 | 22,649,518(0.00%)#4,099 |
| 81. | Burlington | 332 | 276,863(0.12%)#81 | 22,649,518(0.00%)#4,121 |
| 82. | Brush | 330 | 276,863(0.12%)#82 | 22,649,518(0.00%)#4,143 |
| 83. | Fort Carson | 316 | 276,863(0.11%)#83 | 22,649,518(0.00%)#4,223 |
| 84. | Superior | 316 | 276,863(0.11%)#84 | 22,649,518(0.00%)#4,224 |
| 85. | Cherry Creek | 295 | 276,863(0.11%)#85 | 22,649,518(0.00%)#4,366 |
| 86. | Alamosa | 286 | 276,863(0.10%)#86 | 22,649,518(0.00%)#4,433 |
| 87. | Berthoud | 262 | 276,863(0.09%)#87 | 22,649,518(0.00%)#4,613 |
| 88. | Applewood | 262 | 276,863(0.09%)#88 | 22,649,518(0.00%)#4,615 |
| 89. | Wray | 257 | 276,863(0.09%)#89 | 22,649,518(0.00%)#4,647 |
| 90. | Monte Vista | 254 | 276,863(0.09%)#90 | 22,649,518(0.00%)#4,674 |
| 91. | Center | 252 | 276,863(0.09%)#91 | 22,649,518(0.00%)#4,696 |
| 92. | Platteville | 246 | 276,863(0.09%)#92 | 22,649,518(0.00%)#4,739 |
| 93. | Castle Pines | 232 | 276,863(0.08%)#93 | 22,649,518(0.00%)#4,879 |
| 94. | Lone Tree | 230 | 276,863(0.08%)#94 | 22,649,518(0.00%)#4,898 |
| 95. | Dove Valley | 224 | 276,863(0.08%)#95 | 22,649,518(0.00%)#4,964 |
| 96. | Ellicott | 214 | 276,863(0.08%)#96 | 22,649,518(0.00%)#5,065 |
| 97. | Greenwood Village | 209 | 276,863(0.08%)#97 | 22,649,518(0.00%)#5,121 |
| 98. | Milliken | 203 | 276,863(0.07%)#98 | 22,649,518(0.00%)#5,198 |
| 99. | Eaton | 198 | 276,863(0.07%)#99 | 22,649,518(0.00%)#5,251 |
| 100. | Mountain Village | 194 | 276,863(0.07%)#100 | 22,649,518(0.00%)#5,312 |
Common Questions
What are the Top 10 Cities with the Most Immigrants from Latin America in Colorado?
Top 10 Cities with the Most Immigrants from Latin America in Colorado are:
#1
55,331
#2
41,520
#3
14,771
#4
12,740
#5
10,392
#6
7,969
#7
5,871
#8
5,266
#9
4,230
#10
4,091
What city has the Most Immigrants from Latin America in Colorado?
Denver has the Most Immigrants from Latin America in Colorado with 55,331.
What is the Total Immigrants from Latin America in the State of Colorado?
Total Immigrants from Latin America in Colorado is 276,863.
What is the Total Immigrants from Latin America in the United States?
Total Immigrants from Latin America in the United States is 22,649,518.