Cities with the Most Immigrants from Latin America in Vermont
RELATED REPORTS & OPTIONS
Latin America
Vermont
Compare Cities
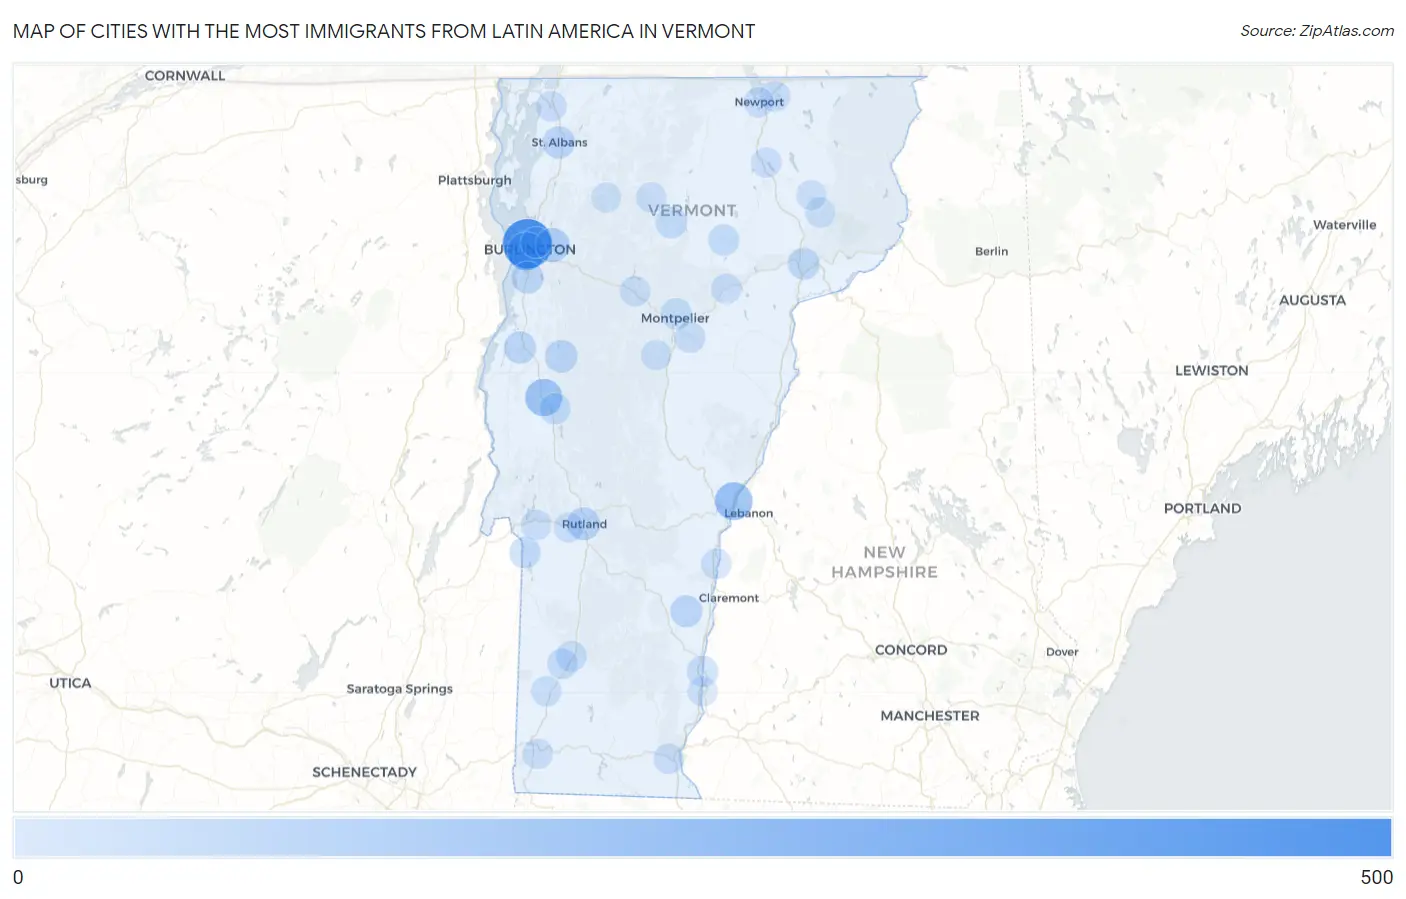
Map of Cities with the Most Immigrants from Latin America in Vermont
0
500
Cities with the Most Immigrants from Latin America in Vermont
| City | Latin America | vs State | vs National | |
| 1. | Burlington | 449 | 3,063(14.66%)#1 | 22,649,518(0.00%)#3,483 |
| 2. | South Burlington | 186 | 3,063(6.07%)#2 | 22,649,518(0.00%)#5,413 |
| 3. | Wilder | 173 | 3,063(5.65%)#3 | 22,649,518(0.00%)#5,608 |
| 4. | Middlebury | 158 | 3,063(5.16%)#4 | 22,649,518(0.00%)#5,861 |
| 5. | Essex Junction | 92 | 3,063(3.00%)#5 | 22,649,518(0.00%)#7,235 |
| 6. | Rutland | 62 | 3,063(2.02%)#6 | 22,649,518(0.00%)#8,289 |
| 7. | Bristol | 55 | 3,063(1.80%)#7 | 22,649,518(0.00%)#8,633 |
| 8. | St Albans | 50 | 3,063(1.63%)#8 | 22,649,518(0.00%)#8,894 |
| 9. | Vergennes | 48 | 3,063(1.57%)#9 | 22,649,518(0.00%)#9,039 |
| 10. | Killington | 48 | 3,063(1.57%)#10 | 22,649,518(0.00%)#9,069 |
| 11. | Shelburne | 45 | 3,063(1.47%)#11 | 22,649,518(0.00%)#9,210 |
| 12. | North Springfield | 42 | 3,063(1.37%)#12 | 22,649,518(0.00%)#9,433 |
| 13. | St Johnsbury | 39 | 3,063(1.27%)#13 | 22,649,518(0.00%)#9,602 |
| 14. | Morrisville | 33 | 3,063(1.08%)#14 | 22,649,518(0.00%)#10,042 |
| 15. | Pawlet | 33 | 3,063(1.08%)#15 | 22,649,518(0.00%)#10,097 |
| 16. | Poultney | 27 | 3,063(0.88%)#16 | 22,649,518(0.00%)#10,651 |
| 17. | Hardwick | 24 | 3,063(0.78%)#17 | 22,649,518(0.00%)#10,997 |
| 18. | Montpelier | 23 | 3,063(0.75%)#18 | 22,649,518(0.00%)#11,053 |
| 19. | Bellows Falls | 23 | 3,063(0.75%)#19 | 22,649,518(0.00%)#11,084 |
| 20. | East Middlebury | 23 | 3,063(0.75%)#20 | 22,649,518(0.00%)#11,158 |
| 21. | Barre | 15 | 3,063(0.49%)#21 | 22,649,518(0.00%)#12,208 |
| 22. | Winooski | 15 | 3,063(0.49%)#22 | 22,649,518(0.00%)#12,209 |
| 23. | Manchester Center | 15 | 3,063(0.49%)#23 | 22,649,518(0.00%)#12,270 |
| 24. | Derby Center | 14 | 3,063(0.46%)#24 | 22,649,518(0.00%)#12,487 |
| 25. | Manchester | 13 | 3,063(0.42%)#25 | 22,649,518(0.00%)#12,674 |
| 26. | Windsor | 10 | 3,063(0.33%)#26 | 22,649,518(0.00%)#13,231 |
| 27. | Swanton | 9 | 3,063(0.29%)#27 | 22,649,518(0.00%)#13,431 |
| 28. | Bennington | 8 | 3,063(0.26%)#28 | 22,649,518(0.00%)#13,632 |
| 29. | West Brattleboro | 8 | 3,063(0.26%)#29 | 22,649,518(0.00%)#13,673 |
| 30. | Waterbury | 8 | 3,063(0.26%)#30 | 22,649,518(0.00%)#13,724 |
| 31. | Algiers | 8 | 3,063(0.26%)#31 | 22,649,518(0.00%)#13,899 |
| 32. | Castleton | 6 | 3,063(0.20%)#32 | 22,649,518(0.00%)#14,383 |
| 33. | Marshfield | 6 | 3,063(0.20%)#33 | 22,649,518(0.00%)#14,470 |
| 34. | Northfield | 5 | 3,063(0.16%)#34 | 22,649,518(0.00%)#14,569 |
| 35. | Arlington | 5 | 3,063(0.16%)#35 | 22,649,518(0.00%)#14,617 |
| 36. | Johnson | 5 | 3,063(0.16%)#36 | 22,649,518(0.00%)#14,648 |
| 37. | Barton | 5 | 3,063(0.16%)#37 | 22,649,518(0.00%)#14,737 |
| 38. | Huntington | 5 | 3,063(0.16%)#38 | 22,649,518(0.00%)#14,761 |
| 39. | St. George | 5 | 3,063(0.16%)#39 | 22,649,518(0.00%)#14,791 |
| 40. | Newport | 4 | 3,063(0.13%)#40 | 22,649,518(0.00%)#14,910 |
| 41. | West Rutland | 4 | 3,063(0.13%)#41 | 22,649,518(0.00%)#14,947 |
| 42. | East Burke | 3 | 3,063(0.10%)#42 | 22,649,518(0.00%)#15,718 |
| 43. | Grafton | 2 | 3,063(0.07%)#43 | 22,649,518(0.00%)#16,226 |
| 44. | Westminster | 1 | 3,063(0.03%)#44 | 22,649,518(0.00%)#16,421 |
| 45. | Cambridge | 1 | 3,063(0.03%)#45 | 22,649,518(0.00%)#16,583 |
| 46. | West Burke | 1 | 3,063(0.03%)#46 | 22,649,518(0.00%)#16,592 |
1
2Common Questions
What are the Top 10 Cities with the Most Immigrants from Latin America in Vermont?
Top 10 Cities with the Most Immigrants from Latin America in Vermont are:
#1
449
#2
186
#3
173
#4
158
#5
92
#6
62
#7
55
#8
50
#9
48
#10
45
What city has the Most Immigrants from Latin America in Vermont?
Burlington has the Most Immigrants from Latin America in Vermont with 449.
What is the Total Immigrants from Latin America in the State of Vermont?
Total Immigrants from Latin America in Vermont is 3,063.
What is the Total Immigrants from Latin America in the United States?
Total Immigrants from Latin America in the United States is 22,649,518.