Cities with the Most Immigrants from Latin America in Mississippi
RELATED REPORTS & OPTIONS
Latin America
Mississippi
Compare Cities
Map of Cities with the Most Immigrants from Latin America in Mississippi
0
2,000
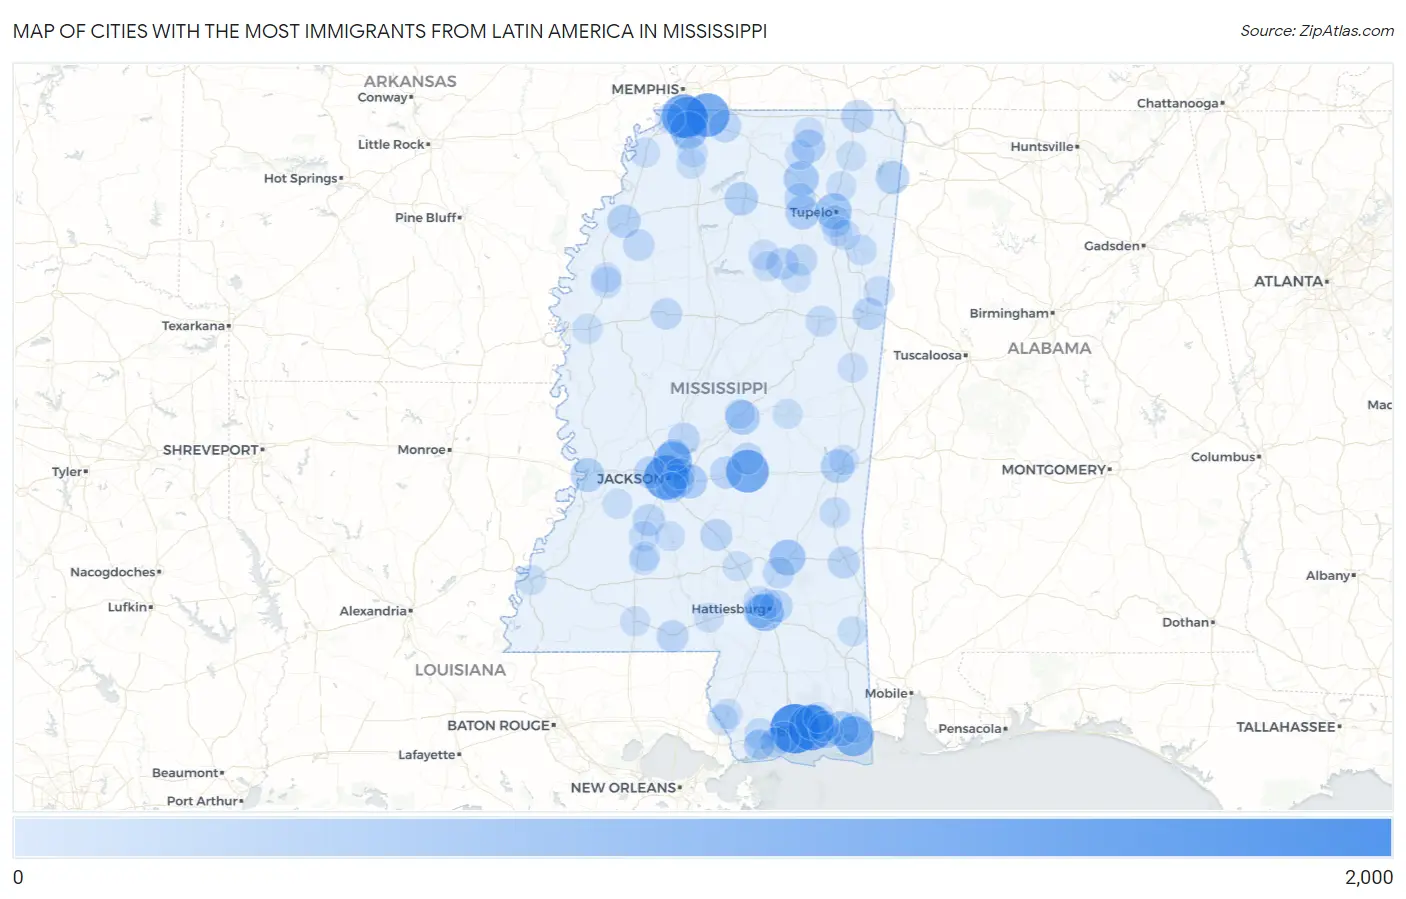
Cities with the Most Immigrants from Latin America in Mississippi
| City | Latin America | vs State | vs National | |
| 1. | Gulfport | 1,651 | 33,210(4.97%)#1 | 22,649,518(0.01%)#1,526 |
| 2. | Biloxi | 1,334 | 33,210(4.02%)#2 | 22,649,518(0.01%)#1,766 |
| 3. | Jackson | 1,205 | 33,210(3.63%)#3 | 22,649,518(0.01%)#1,902 |
| 4. | Horn Lake | 1,163 | 33,210(3.50%)#4 | 22,649,518(0.01%)#1,947 |
| 5. | Olive Branch | 1,138 | 33,210(3.43%)#5 | 22,649,518(0.01%)#1,973 |
| 6. | Forest | 1,060 | 33,210(3.19%)#6 | 22,649,518(0.00%)#2,055 |
| 7. | Southaven | 975 | 33,210(2.94%)#7 | 22,649,518(0.00%)#2,179 |
| 8. | Pascagoula | 840 | 33,210(2.53%)#8 | 22,649,518(0.00%)#2,383 |
| 9. | Ridgeland | 761 | 33,210(2.29%)#9 | 22,649,518(0.00%)#2,548 |
| 10. | Hattiesburg | 620 | 33,210(1.87%)#10 | 22,649,518(0.00%)#2,873 |
| 11. | Hernando | 617 | 33,210(1.86%)#11 | 22,649,518(0.00%)#2,878 |
| 12. | Laurel | 494 | 33,210(1.49%)#12 | 22,649,518(0.00%)#3,301 |
| 13. | Tupelo | 488 | 33,210(1.47%)#13 | 22,649,518(0.00%)#3,325 |
| 14. | Gautier | 427 | 33,210(1.29%)#14 | 22,649,518(0.00%)#3,596 |
| 15. | New Albany | 420 | 33,210(1.26%)#15 | 22,649,518(0.00%)#3,626 |
| 16. | D Iberville | 414 | 33,210(1.25%)#16 | 22,649,518(0.00%)#3,654 |
| 17. | Carthage | 372 | 33,210(1.12%)#17 | 22,649,518(0.00%)#3,881 |
| 18. | Brandon | 361 | 33,210(1.09%)#18 | 22,649,518(0.00%)#3,944 |
| 19. | Pontotoc | 335 | 33,210(1.01%)#19 | 22,649,518(0.00%)#4,107 |
| 20. | Pearl | 325 | 33,210(0.98%)#20 | 22,649,518(0.00%)#4,166 |
| 21. | Vicksburg | 312 | 33,210(0.94%)#21 | 22,649,518(0.00%)#4,243 |
| 22. | Ocean Springs | 311 | 33,210(0.94%)#22 | 22,649,518(0.00%)#4,251 |
| 23. | Meridian | 299 | 33,210(0.90%)#23 | 22,649,518(0.00%)#4,333 |
| 24. | Belmont | 296 | 33,210(0.89%)#24 | 22,649,518(0.00%)#4,361 |
| 25. | West Hattiesburg | 294 | 33,210(0.89%)#25 | 22,649,518(0.00%)#4,377 |
| 26. | Oxford | 292 | 33,210(0.88%)#26 | 22,649,518(0.00%)#4,385 |
| 27. | Ripley | 272 | 33,210(0.82%)#27 | 22,649,518(0.00%)#4,532 |
| 28. | Clarksdale | 263 | 33,210(0.79%)#28 | 22,649,518(0.00%)#4,602 |
| 29. | Corinth | 233 | 33,210(0.70%)#29 | 22,649,518(0.00%)#4,867 |
| 30. | Morton | 205 | 33,210(0.62%)#30 | 22,649,518(0.00%)#5,180 |
| 31. | Petal | 201 | 33,210(0.61%)#31 | 22,649,518(0.00%)#5,216 |
| 32. | Columbus | 195 | 33,210(0.59%)#32 | 22,649,518(0.00%)#5,288 |
| 33. | Byhalia | 189 | 33,210(0.57%)#33 | 22,649,518(0.00%)#5,378 |
| 34. | Canton | 184 | 33,210(0.55%)#34 | 22,649,518(0.00%)#5,436 |
| 35. | Crystal Springs | 181 | 33,210(0.55%)#35 | 22,649,518(0.00%)#5,474 |
| 36. | Madison | 180 | 33,210(0.54%)#36 | 22,649,518(0.00%)#5,480 |
| 37. | Waynesboro | 179 | 33,210(0.54%)#37 | 22,649,518(0.00%)#5,506 |
| 38. | Magee | 178 | 33,210(0.54%)#38 | 22,649,518(0.00%)#5,524 |
| 39. | Clinton | 174 | 33,210(0.52%)#39 | 22,649,518(0.00%)#5,587 |
| 40. | Tylertown | 174 | 33,210(0.52%)#40 | 22,649,518(0.00%)#5,594 |
| 41. | Long Beach | 162 | 33,210(0.49%)#41 | 22,649,518(0.00%)#5,792 |
| 42. | Vardaman | 160 | 33,210(0.48%)#42 | 22,649,518(0.00%)#5,841 |
| 43. | Hillsboro | 157 | 33,210(0.47%)#43 | 22,649,518(0.00%)#5,879 |
| 44. | Houston | 149 | 33,210(0.45%)#44 | 22,649,518(0.00%)#6,006 |
| 45. | Verona | 146 | 33,210(0.44%)#45 | 22,649,518(0.00%)#6,065 |
| 46. | Ellisville | 143 | 33,210(0.43%)#46 | 22,649,518(0.00%)#6,111 |
| 47. | Tutwiler | 137 | 33,210(0.41%)#47 | 22,649,518(0.00%)#6,223 |
| 48. | Greenwood | 127 | 33,210(0.38%)#48 | 22,649,518(0.00%)#6,399 |
| 49. | Ecru | 124 | 33,210(0.37%)#49 | 22,649,518(0.00%)#6,479 |
| 50. | Starkville | 115 | 33,210(0.35%)#50 | 22,649,518(0.00%)#6,667 |
| 51. | Moss Point | 111 | 33,210(0.33%)#51 | 22,649,518(0.00%)#6,756 |
| 52. | Diamondhead | 111 | 33,210(0.33%)#52 | 22,649,518(0.00%)#6,757 |
| 53. | Gulf Hills | 94 | 33,210(0.28%)#53 | 22,649,518(0.00%)#7,172 |
| 54. | Flowood | 93 | 33,210(0.28%)#54 | 22,649,518(0.00%)#7,206 |
| 55. | Nicholson | 89 | 33,210(0.27%)#55 | 22,649,518(0.00%)#7,362 |
| 56. | Cleveland | 84 | 33,210(0.25%)#56 | 22,649,518(0.00%)#7,498 |
| 57. | Amory | 81 | 33,210(0.24%)#57 | 22,649,518(0.00%)#7,612 |
| 58. | Richland | 74 | 33,210(0.22%)#58 | 22,649,518(0.00%)#7,838 |
| 59. | Quitman | 73 | 33,210(0.22%)#59 | 22,649,518(0.00%)#7,892 |
| 60. | Latimer | 68 | 33,210(0.20%)#60 | 22,649,518(0.00%)#8,060 |
| 61. | Pittsboro | 67 | 33,210(0.20%)#61 | 22,649,518(0.00%)#8,127 |
| 62. | Rawls Springs | 64 | 33,210(0.19%)#62 | 22,649,518(0.00%)#8,240 |
| 63. | Caledonia | 61 | 33,210(0.18%)#63 | 22,649,518(0.00%)#8,365 |
| 64. | Bay St Louis | 55 | 33,210(0.17%)#64 | 22,649,518(0.00%)#8,602 |
| 65. | Nettleton | 54 | 33,210(0.16%)#65 | 22,649,518(0.00%)#8,689 |
| 66. | Lakeview | 51 | 33,210(0.15%)#66 | 22,649,518(0.00%)#8,880 |
| 67. | Hazlehurst | 50 | 33,210(0.15%)#67 | 22,649,518(0.00%)#8,903 |
| 68. | Waveland | 44 | 33,210(0.13%)#68 | 22,649,518(0.00%)#9,273 |
| 69. | Marion | 41 | 33,210(0.12%)#69 | 22,649,518(0.00%)#9,490 |
| 70. | Eastabuchie | 36 | 33,210(0.11%)#70 | 22,649,518(0.00%)#9,867 |
| 71. | Tunica | 35 | 33,210(0.11%)#71 | 22,649,518(0.00%)#9,920 |
| 72. | Leland | 33 | 33,210(0.10%)#72 | 22,649,518(0.00%)#10,029 |
| 73. | Calhoun City | 33 | 33,210(0.10%)#73 | 22,649,518(0.00%)#10,053 |
| 74. | Natchez | 32 | 33,210(0.10%)#74 | 22,649,518(0.00%)#10,105 |
| 75. | Picayune | 29 | 33,210(0.09%)#75 | 22,649,518(0.00%)#10,373 |
| 76. | Collins | 29 | 33,210(0.09%)#76 | 22,649,518(0.00%)#10,417 |
| 77. | Senatobia | 28 | 33,210(0.08%)#77 | 22,649,518(0.00%)#10,483 |
| 78. | Gluckstadt | 28 | 33,210(0.08%)#78 | 22,649,518(0.00%)#10,503 |
| 79. | Utica | 27 | 33,210(0.08%)#79 | 22,649,518(0.00%)#10,659 |
| 80. | Philadelphia | 26 | 33,210(0.08%)#80 | 22,649,518(0.00%)#10,700 |
| 81. | Pass Christian | 26 | 33,210(0.08%)#81 | 22,649,518(0.00%)#10,704 |
| 82. | Coldwater | 26 | 33,210(0.08%)#82 | 22,649,518(0.00%)#10,751 |
| 83. | Redwater | 26 | 33,210(0.08%)#83 | 22,649,518(0.00%)#10,774 |
| 84. | Shannon | 24 | 33,210(0.07%)#84 | 22,649,518(0.00%)#10,976 |
| 85. | Mccomb | 22 | 33,210(0.07%)#85 | 22,649,518(0.00%)#11,180 |
| 86. | Victoria | 22 | 33,210(0.07%)#86 | 22,649,518(0.00%)#11,249 |
| 87. | Glendale | 21 | 33,210(0.06%)#87 | 22,649,518(0.00%)#11,384 |
| 88. | Blue Mountain | 19 | 33,210(0.06%)#88 | 22,649,518(0.00%)#11,656 |
| 89. | Leakesville | 18 | 33,210(0.05%)#89 | 22,649,518(0.00%)#11,721 |
| 90. | Columbia | 17 | 33,210(0.05%)#90 | 22,649,518(0.00%)#11,897 |
| 91. | Macon | 17 | 33,210(0.05%)#91 | 22,649,518(0.00%)#11,918 |
| 92. | Wesson | 17 | 33,210(0.05%)#92 | 22,649,518(0.00%)#11,927 |
| 93. | Falkner | 17 | 33,210(0.05%)#93 | 22,649,518(0.00%)#11,982 |
| 94. | Booneville | 16 | 33,210(0.05%)#94 | 22,649,518(0.00%)#12,048 |
| 95. | Guntown | 16 | 33,210(0.05%)#95 | 22,649,518(0.00%)#12,096 |
| 96. | Renova | 16 | 33,210(0.05%)#96 | 22,649,518(0.00%)#12,145 |
| 97. | Walls | 15 | 33,210(0.05%)#97 | 22,649,518(0.00%)#12,291 |
| 98. | Georgetown | 14 | 33,210(0.04%)#98 | 22,649,518(0.00%)#12,523 |
| 99. | Beauregard | 13 | 33,210(0.04%)#99 | 22,649,518(0.00%)#12,697 |
| 100. | Woodland | 13 | 33,210(0.04%)#100 | 22,649,518(0.00%)#12,731 |
Common Questions
What are the Top 10 Cities with the Most Immigrants from Latin America in Mississippi?
Top 10 Cities with the Most Immigrants from Latin America in Mississippi are:
#1
1,651
#2
1,334
#3
1,205
#4
1,163
#5
1,138
#6
1,060
#7
975
#8
840
#9
761
#10
620
What city has the Most Immigrants from Latin America in Mississippi?
Gulfport has the Most Immigrants from Latin America in Mississippi with 1,651.
What is the Total Immigrants from Latin America in the State of Mississippi?
Total Immigrants from Latin America in Mississippi is 33,210.
What is the Total Immigrants from Latin America in the United States?
Total Immigrants from Latin America in the United States is 22,649,518.