Cities with the Highest Percentage of Native Hawaiian Population in Virginia
RELATED REPORTS & OPTIONS
Native Hawaiian
Virginia
Compare Cities
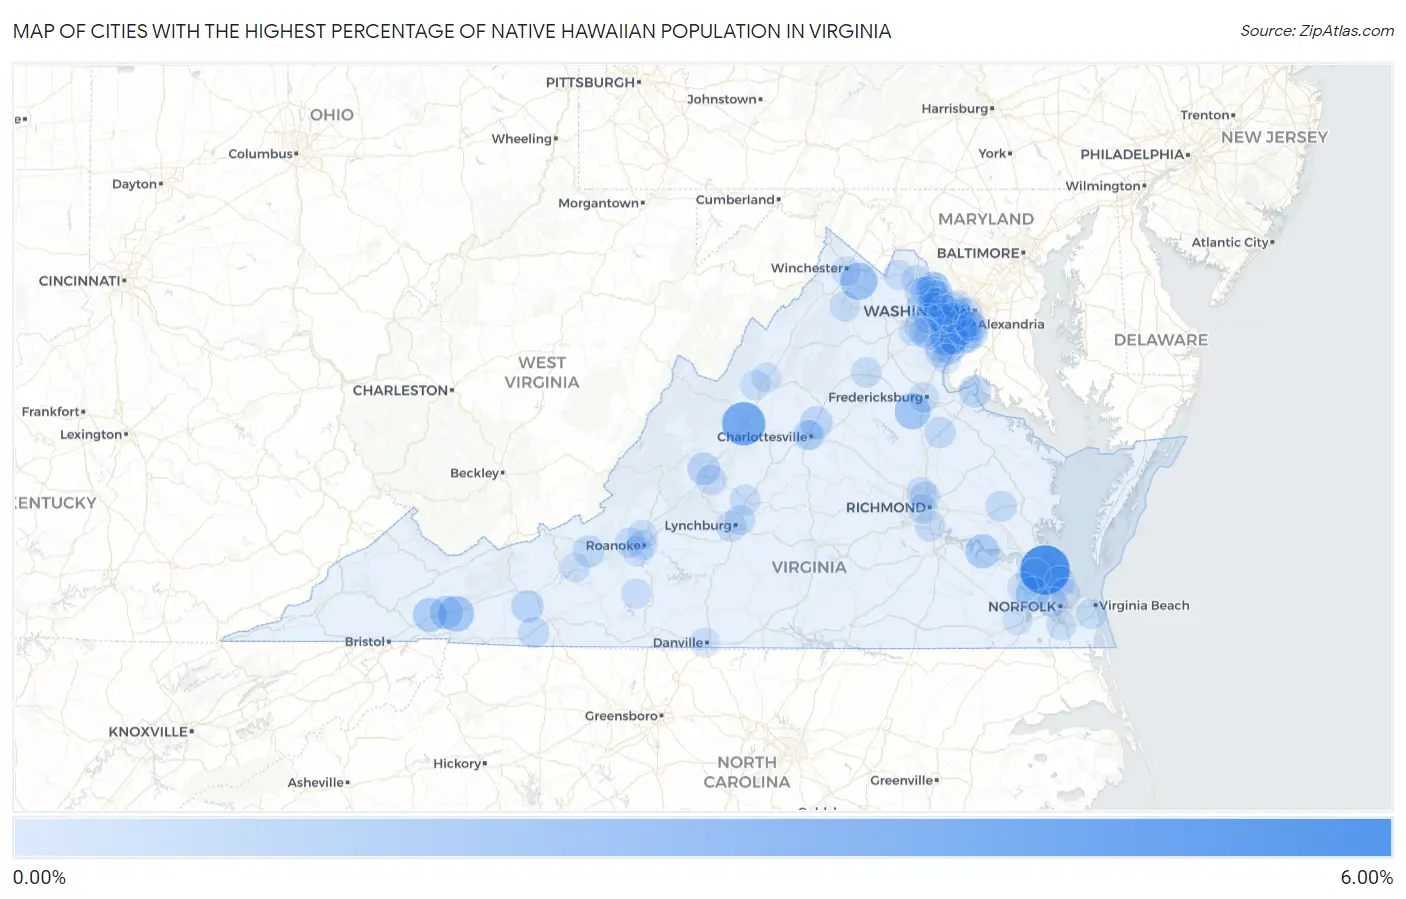
Map of Cities with the Highest Percentage of Native Hawaiian Population in Virginia
0.00%
6.00%
Cities with the Highest Percentage of Native Hawaiian Population in Virginia
| City | Native Hawaiian | vs State | vs National | |
| 1. | Bethel Manor | 5.61% | 0.077%(+5.53)#1 | 0.20%(+5.41)#197 |
| 2. | Jolivue | 3.79% | 0.077%(+3.71)#2 | 0.20%(+3.59)#244 |
| 3. | Boyce | 1.99% | 0.077%(+1.91)#3 | 0.20%(+1.79)#383 |
| 4. | Crosspointe | 1.79% | 0.077%(+1.71)#4 | 0.20%(+1.59)#409 |
| 5. | Spotsylvania Courthouse | 1.71% | 0.077%(+1.63)#5 | 0.20%(+1.51)#424 |
| 6. | Adwolf | 1.60% | 0.077%(+1.53)#6 | 0.20%(+1.41)#447 |
| 7. | Rio | 1.44% | 0.077%(+1.37)#7 | 0.20%(+1.25)#487 |
| 8. | Claremont | 1.19% | 0.077%(+1.11)#8 | 0.20%(+0.990)#574 |
| 9. | Emory | 1.14% | 0.077%(+1.06)#9 | 0.20%(+0.943)#594 |
| 10. | Carrollton | 1.02% | 0.077%(+0.946)#10 | 0.20%(+0.825)#650 |
| 11. | Chilhowie | 0.97% | 0.077%(+0.893)#11 | 0.20%(+0.772)#680 |
| 12. | Fort Belvoir | 0.79% | 0.077%(+0.717)#12 | 0.20%(+0.596)#792 |
| 13. | East Lexington | 0.74% | 0.077%(+0.661)#13 | 0.20%(+0.540)#848 |
| 14. | Dahlgren Center | 0.69% | 0.077%(+0.615)#14 | 0.20%(+0.494)#887 |
| 15. | Ivanhoe | 0.66% | 0.077%(+0.581)#15 | 0.20%(+0.460)#932 |
| 16. | Hollymead | 0.64% | 0.077%(+0.564)#16 | 0.20%(+0.443)#951 |
| 17. | Cascades | 0.53% | 0.077%(+0.449)#17 | 0.20%(+0.329)#1,126 |
| 18. | Countryside | 0.49% | 0.077%(+0.411)#18 | 0.20%(+0.290)#1,199 |
| 19. | Leesylvania | 0.47% | 0.077%(+0.398)#19 | 0.20%(+0.277)#1,221 |
| 20. | Dulles Town Center | 0.46% | 0.077%(+0.382)#20 | 0.20%(+0.261)#1,243 |
| 21. | Dranesville | 0.44% | 0.077%(+0.368)#21 | 0.20%(+0.247)#1,268 |
| 22. | Blacksburg | 0.40% | 0.077%(+0.326)#22 | 0.20%(+0.205)#1,362 |
| 23. | Bowling Green | 0.39% | 0.077%(+0.313)#23 | 0.20%(+0.192)#1,402 |
| 24. | Galax | 0.36% | 0.077%(+0.282)#24 | 0.20%(+0.161)#1,490 |
| 25. | Greenbriar | 0.35% | 0.077%(+0.276)#25 | 0.20%(+0.155)#1,502 |
| 26. | West Point | 0.32% | 0.077%(+0.247)#26 | 0.20%(+0.126)#1,585 |
| 27. | Burke | 0.31% | 0.077%(+0.238)#27 | 0.20%(+0.117)#1,617 |
| 28. | Annandale | 0.31% | 0.077%(+0.235)#28 | 0.20%(+0.114)#1,630 |
| 29. | Hayfield | 0.30% | 0.077%(+0.219)#29 | 0.20%(+0.098)#1,691 |
| 30. | Newport News | 0.28% | 0.077%(+0.201)#30 | 0.20%(+0.080)#1,764 |
| 31. | Bull Run | 0.27% | 0.077%(+0.194)#31 | 0.20%(+0.073)#1,791 |
| 32. | Buena Vista | 0.23% | 0.077%(+0.149)#32 | 0.20%(+0.028)#1,980 |
| 33. | Mount Vernon | 0.23% | 0.077%(+0.149)#33 | 0.20%(+0.028)#1,985 |
| 34. | Fair Oaks | 0.22% | 0.077%(+0.142)#34 | 0.20%(+0.021)#2,023 |
| 35. | Amherst | 0.22% | 0.077%(+0.141)#35 | 0.20%(+0.020)#2,033 |
| 36. | Falls Church | 0.21% | 0.077%(+0.136)#36 | 0.20%(+0.015)#2,061 |
| 37. | Culpeper | 0.19% | 0.077%(+0.112)#37 | 0.20%(-0.009)#2,176 |
| 38. | Broadlands | 0.19% | 0.077%(+0.108)#38 | 0.20%(-0.013)#2,194 |
| 39. | Lynchburg | 0.18% | 0.077%(+0.105)#39 | 0.20%(-0.016)#2,211 |
| 40. | Fredericksburg | 0.18% | 0.077%(+0.104)#40 | 0.20%(-0.017)#2,219 |
| 41. | Woodbridge | 0.18% | 0.077%(+0.102)#41 | 0.20%(-0.019)#2,230 |
| 42. | Belle Haven | 0.17% | 0.077%(+0.096)#42 | 0.20%(-0.025)#2,261 |
| 43. | Sterling | 0.17% | 0.077%(+0.091)#43 | 0.20%(-0.030)#2,294 |
| 44. | Laurel Hill | 0.16% | 0.077%(+0.087)#44 | 0.20%(-0.034)#2,316 |
| 45. | Virginia Beach | 0.16% | 0.077%(+0.084)#45 | 0.20%(-0.037)#2,335 |
| 46. | Madison Heights | 0.16% | 0.077%(+0.082)#46 | 0.20%(-0.039)#2,343 |
| 47. | Fort Hunt | 0.16% | 0.077%(+0.079)#47 | 0.20%(-0.042)#2,360 |
| 48. | Front Royal | 0.15% | 0.077%(+0.076)#48 | 0.20%(-0.045)#2,388 |
| 49. | Laurel | 0.15% | 0.077%(+0.069)#49 | 0.20%(-0.052)#2,444 |
| 50. | Cave Spring | 0.15% | 0.077%(+0.069)#50 | 0.20%(-0.052)#2,445 |
| 51. | Smithfield | 0.14% | 0.077%(+0.062)#51 | 0.20%(-0.059)#2,498 |
| 52. | Burke Centre | 0.12% | 0.077%(+0.046)#52 | 0.20%(-0.075)#2,615 |
| 53. | Hampton | 0.12% | 0.077%(+0.046)#53 | 0.20%(-0.075)#2,618 |
| 54. | Ferrum | 0.12% | 0.077%(+0.040)#54 | 0.20%(-0.081)#2,657 |
| 55. | Montclair | 0.11% | 0.077%(+0.036)#55 | 0.20%(-0.085)#2,686 |
| 56. | South Riding | 0.11% | 0.077%(+0.034)#56 | 0.20%(-0.087)#2,708 |
| 57. | Dale City | 0.11% | 0.077%(+0.031)#57 | 0.20%(-0.089)#2,730 |
| 58. | Kings Park West | 0.11% | 0.077%(+0.029)#58 | 0.20%(-0.092)#2,752 |
| 59. | Midlothian | 0.10% | 0.077%(+0.028)#59 | 0.20%(-0.093)#2,754 |
| 60. | Bellwood | 0.10% | 0.077%(+0.026)#60 | 0.20%(-0.095)#2,769 |
| 61. | Lake Ridge | 0.10% | 0.077%(+0.024)#61 | 0.20%(-0.097)#2,792 |
| 62. | Norfolk | 0.099% | 0.077%(+0.022)#62 | 0.20%(-0.099)#2,809 |
| 63. | Mcnair | 0.099% | 0.077%(+0.022)#63 | 0.20%(-0.099)#2,810 |
| 64. | Bridgewater | 0.091% | 0.077%(+0.015)#64 | 0.20%(-0.106)#2,876 |
| 65. | Lakeside | 0.091% | 0.077%(+0.014)#65 | 0.20%(-0.107)#2,883 |
| 66. | Purcellville | 0.090% | 0.077%(+0.013)#66 | 0.20%(-0.108)#2,896 |
| 67. | Chesapeake | 0.081% | 0.077%(+0.004)#67 | 0.20%(-0.117)#2,976 |
| 68. | Rose Hill Cdp Fairfax County | 0.080% | 0.077%(+0.003)#68 | 0.20%(-0.118)#2,981 |
| 69. | Salem | 0.079% | 0.077%(+0.002)#69 | 0.20%(-0.119)#2,995 |
| 70. | Portsmouth | 0.077% | 0.077%(+0.000)#70 | 0.20%(-0.121)#3,015 |
| 71. | Roanoke | 0.077% | 0.077%(-0.000)#71 | 0.20%(-0.121)#3,023 |
| 72. | Buckhall | 0.075% | 0.077%(-0.002)#72 | 0.20%(-0.123)#3,043 |
| 73. | Tysons | 0.065% | 0.077%(-0.012)#73 | 0.20%(-0.133)#3,131 |
| 74. | Arlington | 0.062% | 0.077%(-0.014)#74 | 0.20%(-0.135)#3,164 |
| 75. | University Of Virginia | 0.062% | 0.077%(-0.015)#75 | 0.20%(-0.136)#3,165 |
| 76. | Franklin Farm | 0.058% | 0.077%(-0.019)#76 | 0.20%(-0.140)#3,224 |
| 77. | Lorton | 0.054% | 0.077%(-0.022)#77 | 0.20%(-0.143)#3,260 |
| 78. | Leesburg | 0.054% | 0.077%(-0.023)#78 | 0.20%(-0.144)#3,273 |
| 79. | West Falls Church | 0.051% | 0.077%(-0.025)#79 | 0.20%(-0.146)#3,294 |
| 80. | Reston | 0.047% | 0.077%(-0.030)#80 | 0.20%(-0.151)#3,341 |
| 81. | Richmond | 0.046% | 0.077%(-0.031)#81 | 0.20%(-0.151)#3,346 |
| 82. | Kingstowne | 0.044% | 0.077%(-0.033)#82 | 0.20%(-0.154)#3,378 |
| 83. | Hollins | 0.043% | 0.077%(-0.034)#83 | 0.20%(-0.155)#3,391 |
| 84. | George Mason | 0.040% | 0.077%(-0.037)#84 | 0.20%(-0.158)#3,426 |
| 85. | Charlottesville | 0.037% | 0.077%(-0.040)#85 | 0.20%(-0.161)#3,458 |
| 86. | Mclean | 0.030% | 0.077%(-0.046)#86 | 0.20%(-0.167)#3,543 |
| 87. | Woodburn | 0.030% | 0.077%(-0.047)#87 | 0.20%(-0.168)#3,547 |
| 88. | Oakton | 0.030% | 0.077%(-0.047)#88 | 0.20%(-0.168)#3,548 |
| 89. | Alexandria | 0.026% | 0.077%(-0.051)#89 | 0.20%(-0.172)#3,602 |
| 90. | Radford | 0.024% | 0.077%(-0.052)#90 | 0.20%(-0.173)#3,626 |
| 91. | Centreville | 0.023% | 0.077%(-0.053)#91 | 0.20%(-0.174)#3,642 |
| 92. | Cherry Hill | 0.022% | 0.077%(-0.055)#92 | 0.20%(-0.175)#3,661 |
| 93. | Linton Hall | 0.021% | 0.077%(-0.056)#93 | 0.20%(-0.177)#3,679 |
| 94. | Ashburn | 0.020% | 0.077%(-0.057)#94 | 0.20%(-0.178)#3,699 |
| 95. | Harrisonburg | 0.017% | 0.077%(-0.059)#95 | 0.20%(-0.180)#3,741 |
| 96. | Huntington | 0.014% | 0.077%(-0.062)#96 | 0.20%(-0.183)#3,785 |
| 97. | Manassas | 0.012% | 0.077%(-0.065)#97 | 0.20%(-0.186)#3,819 |
| 98. | Suffolk | 0.0095% | 0.077%(-0.067)#98 | 0.20%(-0.188)#3,851 |
| 99. | Winchester | 0.0071% | 0.077%(-0.070)#99 | 0.20%(-0.191)#3,872 |
| 100. | Danville | 0.0071% | 0.077%(-0.070)#100 | 0.20%(-0.191)#3,874 |
1
2Common Questions
What are the Top 10 Cities with the Highest Percentage of Native Hawaiian Population in Virginia?
Top 10 Cities with the Highest Percentage of Native Hawaiian Population in Virginia are:
#1
5.61%
#2
3.79%
#3
1.99%
#4
1.79%
#5
1.71%
#6
1.60%
#7
1.19%
#8
1.14%
#9
1.02%
#10
0.97%
What city has the Highest Percentage of Native Hawaiian Population in Virginia?
Bethel Manor has the Highest Percentage of Native Hawaiian Population in Virginia with 5.61%.
What is the Percentage of Native Hawaiian Population in the State of Virginia?
Percentage of Native Hawaiian Population in Virginia is 0.077%.
What is the Percentage of Native Hawaiian Population in the United States?
Percentage of Native Hawaiian Population in the United States is 0.20%.