Cities with the Highest Percentage of Immigrants from Western Europe in North Carolina
RELATED REPORTS & OPTIONS
Western Europe
North Carolina
Compare Cities
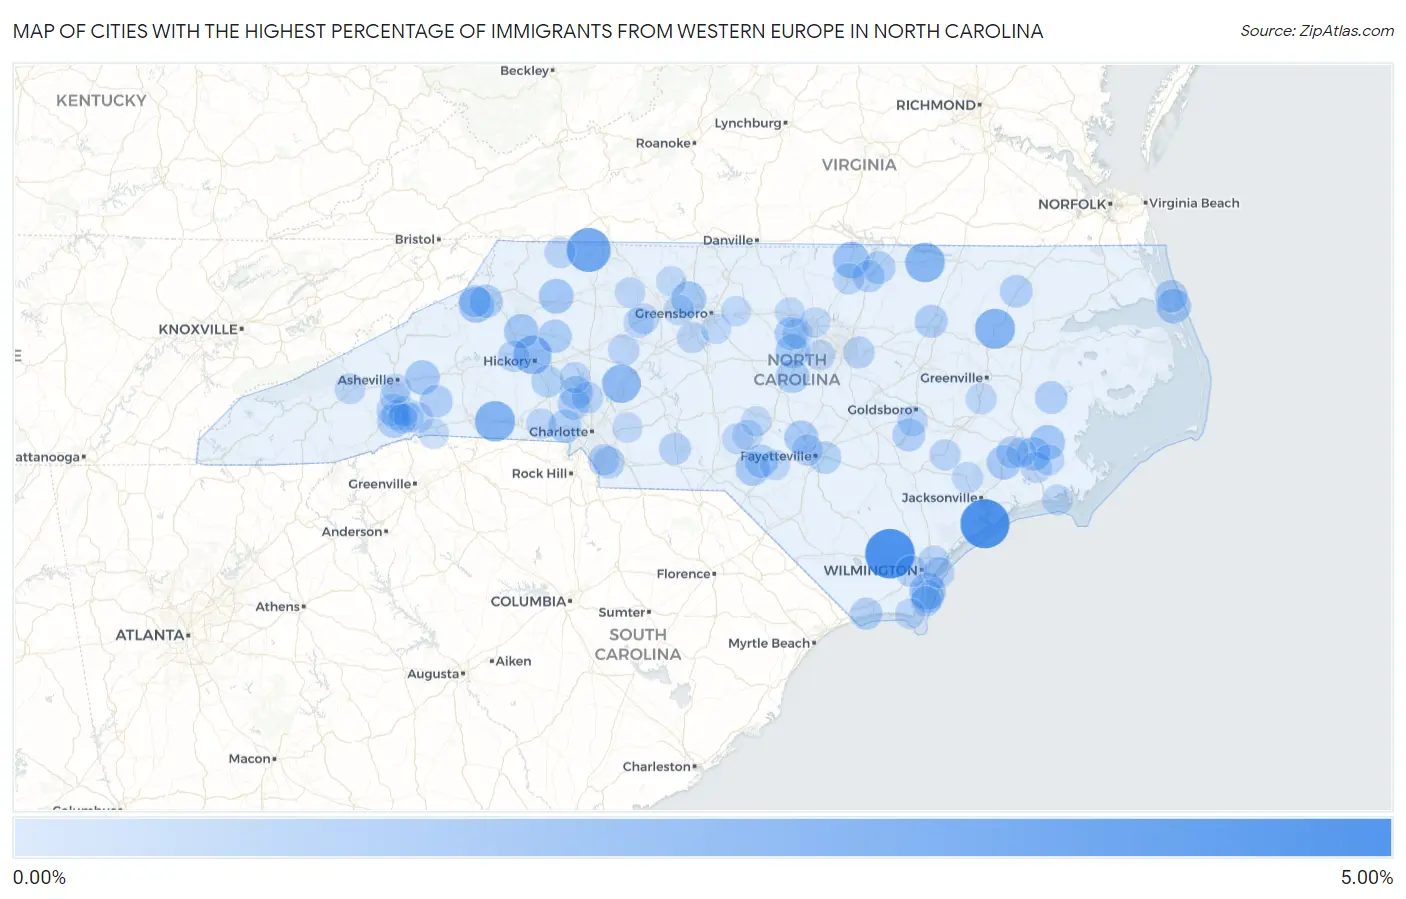
Map of Cities with the Highest Percentage of Immigrants from Western Europe in North Carolina
0.00%
5.00%
Cities with the Highest Percentage of Immigrants from Western Europe in North Carolina
| City | Western Europe | vs State | vs National | |
| 1. | Riegelwood | 4.41% | 0.21%(+4.19)#1 | 0.28%(+4.13)#152 |
| 2. | Sneads Ferry | 4.30% | 0.21%(+4.08)#2 | 0.28%(+4.02)#155 |
| 3. | Lowgap | 3.19% | 0.21%(+2.98)#3 | 0.28%(+2.91)#229 |
| 4. | Cape Colony | 2.84% | 0.21%(+2.63)#4 | 0.28%(+2.56)#281 |
| 5. | Mooresboro | 2.45% | 0.21%(+2.24)#5 | 0.28%(+2.17)#364 |
| 6. | Oak City | 2.38% | 0.21%(+2.17)#6 | 0.28%(+2.10)#383 |
| 7. | Littleton | 2.29% | 0.21%(+2.07)#7 | 0.28%(+2.01)#410 |
| 8. | Northlakes | 2.03% | 0.21%(+1.82)#8 | 0.28%(+1.75)#503 |
| 9. | China Grove | 2.02% | 0.21%(+1.81)#9 | 0.28%(+1.74)#506 |
| 10. | Brandywine Bay | 1.94% | 0.21%(+1.73)#10 | 0.28%(+1.66)#541 |
| 11. | Sea Breeze | 1.63% | 0.21%(+1.42)#11 | 0.28%(+1.35)#704 |
| 12. | Stovall | 1.60% | 0.21%(+1.39)#12 | 0.28%(+1.33)#723 |
| 13. | Sugar Mountain | 1.43% | 0.21%(+1.22)#13 | 0.28%(+1.15)#844 |
| 14. | Grantsboro | 1.33% | 0.21%(+1.11)#14 | 0.28%(+1.05)#955 |
| 15. | Fairplains | 1.29% | 0.21%(+1.07)#15 | 0.28%(+1.01)#993 |
| 16. | Oak Ridge | 1.28% | 0.21%(+1.07)#16 | 0.28%(+1.00)#1,000 |
| 17. | Southern Shores | 1.26% | 0.21%(+1.04)#17 | 0.28%(+0.980)#1,029 |
| 18. | Cedar Rock | 1.22% | 0.21%(+1.01)#18 | 0.28%(+0.943)#1,061 |
| 19. | Black Mountain | 1.21% | 0.21%(+0.995)#19 | 0.28%(+0.931)#1,077 |
| 20. | Pollocksville | 1.17% | 0.21%(+0.955)#20 | 0.28%(+0.890)#1,146 |
| 21. | Fearrington Village | 1.12% | 0.21%(+0.909)#21 | 0.28%(+0.844)#1,205 |
| 22. | Deercroft | 1.12% | 0.21%(+0.901)#22 | 0.28%(+0.837)#1,216 |
| 23. | Spring Lake | 1.11% | 0.21%(+0.896)#23 | 0.28%(+0.831)#1,223 |
| 24. | Moncure | 1.03% | 0.21%(+0.818)#24 | 0.28%(+0.753)#1,367 |
| 25. | Fairfield Harbour | 1.03% | 0.21%(+0.815)#25 | 0.28%(+0.751)#1,375 |
| 26. | Taylorsville | 1.00% | 0.21%(+0.786)#26 | 0.28%(+0.722)#1,431 |
| 27. | Foscoe | 0.99% | 0.21%(+0.778)#27 | 0.28%(+0.713)#1,443 |
| 28. | Carrboro | 0.99% | 0.21%(+0.774)#28 | 0.28%(+0.709)#1,450 |
| 29. | Mcadenville | 0.98% | 0.21%(+0.763)#29 | 0.28%(+0.699)#1,475 |
| 30. | Etowah | 0.98% | 0.21%(+0.761)#30 | 0.28%(+0.696)#1,479 |
| 31. | Five Points | 0.97% | 0.21%(+0.754)#31 | 0.28%(+0.689)#1,494 |
| 32. | Dortches | 0.92% | 0.21%(+0.707)#32 | 0.28%(+0.643)#1,596 |
| 33. | Westport | 0.92% | 0.21%(+0.704)#33 | 0.28%(+0.640)#1,605 |
| 34. | Middleburg | 0.90% | 0.21%(+0.682)#34 | 0.28%(+0.618)#1,663 |
| 35. | Carolina Beach | 0.90% | 0.21%(+0.682)#35 | 0.28%(+0.617)#1,665 |
| 36. | Lake Lure | 0.89% | 0.21%(+0.674)#36 | 0.28%(+0.610)#1,687 |
| 37. | Duck | 0.87% | 0.21%(+0.660)#37 | 0.28%(+0.595)#1,729 |
| 38. | Mount Olive | 0.86% | 0.21%(+0.649)#38 | 0.28%(+0.584)#1,760 |
| 39. | Aulander | 0.85% | 0.21%(+0.638)#39 | 0.28%(+0.573)#1,778 |
| 40. | Bath | 0.85% | 0.21%(+0.633)#40 | 0.28%(+0.568)#1,792 |
| 41. | Vander | 0.81% | 0.21%(+0.596)#41 | 0.28%(+0.531)#1,890 |
| 42. | Maiden | 0.78% | 0.21%(+0.563)#42 | 0.28%(+0.499)#1,996 |
| 43. | Henderson | 0.77% | 0.21%(+0.552)#43 | 0.28%(+0.488)#2,031 |
| 44. | River Bend | 0.75% | 0.21%(+0.540)#44 | 0.28%(+0.476)#2,072 |
| 45. | Anderson Creek | 0.75% | 0.21%(+0.533)#45 | 0.28%(+0.468)#2,087 |
| 46. | Ansonville | 0.75% | 0.21%(+0.531)#46 | 0.28%(+0.466)#2,097 |
| 47. | Ocean Isle Beach | 0.74% | 0.21%(+0.527)#47 | 0.28%(+0.462)#2,112 |
| 48. | Banner Elk | 0.73% | 0.21%(+0.515)#48 | 0.28%(+0.450)#2,167 |
| 49. | Lowesville | 0.73% | 0.21%(+0.514)#49 | 0.28%(+0.450)#2,173 |
| 50. | Wesley Chapel | 0.72% | 0.21%(+0.504)#50 | 0.28%(+0.440)#2,206 |
| 51. | Mills River | 0.70% | 0.21%(+0.490)#51 | 0.28%(+0.425)#2,253 |
| 52. | Knightdale | 0.68% | 0.21%(+0.470)#52 | 0.28%(+0.406)#2,315 |
| 53. | Leland | 0.63% | 0.21%(+0.419)#53 | 0.28%(+0.354)#2,563 |
| 54. | Rutherford College | 0.63% | 0.21%(+0.411)#54 | 0.28%(+0.346)#2,606 |
| 55. | Cornelius | 0.62% | 0.21%(+0.403)#55 | 0.28%(+0.339)#2,640 |
| 56. | Oxford | 0.61% | 0.21%(+0.396)#56 | 0.28%(+0.331)#2,694 |
| 57. | Dana | 0.61% | 0.21%(+0.392)#57 | 0.28%(+0.327)#2,722 |
| 58. | Weddington | 0.59% | 0.21%(+0.377)#58 | 0.28%(+0.313)#2,780 |
| 59. | Murraysville | 0.59% | 0.21%(+0.373)#59 | 0.28%(+0.309)#2,806 |
| 60. | Fayetteville | 0.58% | 0.21%(+0.369)#60 | 0.28%(+0.304)#2,830 |
| 61. | Archdale | 0.57% | 0.21%(+0.358)#61 | 0.28%(+0.293)#2,877 |
| 62. | Cooleemee | 0.57% | 0.21%(+0.357)#62 | 0.28%(+0.292)#2,888 |
| 63. | Pink Hill | 0.57% | 0.21%(+0.354)#63 | 0.28%(+0.289)#2,903 |
| 64. | Wrightsville Beach | 0.56% | 0.21%(+0.347)#64 | 0.28%(+0.283)#2,943 |
| 65. | Sparta | 0.56% | 0.21%(+0.342)#65 | 0.28%(+0.278)#2,970 |
| 66. | Neuse Forest | 0.55% | 0.21%(+0.337)#66 | 0.28%(+0.272)#2,997 |
| 67. | Arapahoe | 0.55% | 0.21%(+0.335)#67 | 0.28%(+0.270)#3,005 |
| 68. | Richlands | 0.54% | 0.21%(+0.329)#68 | 0.28%(+0.264)#3,042 |
| 69. | Lake Norman Of Catawba | 0.54% | 0.21%(+0.328)#69 | 0.28%(+0.264)#3,045 |
| 70. | Ayden | 0.54% | 0.21%(+0.325)#70 | 0.28%(+0.261)#3,063 |
| 71. | Foxfire | 0.50% | 0.21%(+0.289)#71 | 0.28%(+0.225)#3,298 |
| 72. | Chapel Hill | 0.47% | 0.21%(+0.257)#72 | 0.28%(+0.193)#3,534 |
| 73. | Lake Junaluska | 0.47% | 0.21%(+0.256)#73 | 0.28%(+0.191)#3,538 |
| 74. | Clemmons | 0.47% | 0.21%(+0.255)#74 | 0.28%(+0.191)#3,544 |
| 75. | Morehead City | 0.46% | 0.21%(+0.242)#75 | 0.28%(+0.178)#3,636 |
| 76. | Bermuda Run | 0.45% | 0.21%(+0.234)#76 | 0.28%(+0.170)#3,696 |
| 77. | Brogden | 0.44% | 0.21%(+0.223)#77 | 0.28%(+0.158)#3,793 |
| 78. | Kure Beach | 0.43% | 0.21%(+0.218)#78 | 0.28%(+0.153)#3,821 |
| 79. | Cary | 0.43% | 0.21%(+0.217)#79 | 0.28%(+0.152)#3,827 |
| 80. | Pinehurst | 0.43% | 0.21%(+0.216)#80 | 0.28%(+0.151)#3,842 |
| 81. | Bessemer City | 0.42% | 0.21%(+0.206)#81 | 0.28%(+0.141)#3,920 |
| 82. | Kernersville | 0.42% | 0.21%(+0.205)#82 | 0.28%(+0.140)#3,931 |
| 83. | Caswell Beach | 0.41% | 0.21%(+0.194)#83 | 0.28%(+0.130)#4,028 |
| 84. | East Bend | 0.40% | 0.21%(+0.190)#84 | 0.28%(+0.126)#4,081 |
| 85. | Durham | 0.40% | 0.21%(+0.182)#85 | 0.28%(+0.117)#4,152 |
| 86. | Carthage | 0.40% | 0.21%(+0.181)#86 | 0.28%(+0.117)#4,160 |
| 87. | Tryon | 0.40% | 0.21%(+0.181)#87 | 0.28%(+0.117)#4,161 |
| 88. | Walnut Cove | 0.39% | 0.21%(+0.180)#88 | 0.28%(+0.115)#4,172 |
| 89. | Raeford | 0.39% | 0.21%(+0.179)#89 | 0.28%(+0.115)#4,179 |
| 90. | New Bern | 0.39% | 0.21%(+0.177)#90 | 0.28%(+0.113)#4,206 |
| 91. | Avery Creek | 0.39% | 0.21%(+0.175)#91 | 0.28%(+0.110)#4,238 |
| 92. | Pleasant Garden | 0.38% | 0.21%(+0.166)#92 | 0.28%(+0.102)#4,319 |
| 93. | Horse Shoe | 0.38% | 0.21%(+0.163)#93 | 0.28%(+0.098)#4,352 |
| 94. | Mountain Home | 0.37% | 0.21%(+0.158)#94 | 0.28%(+0.093)#4,421 |
| 95. | Asheville | 0.37% | 0.21%(+0.156)#95 | 0.28%(+0.091)#4,441 |
| 96. | Hillsborough | 0.37% | 0.21%(+0.152)#96 | 0.28%(+0.088)#4,469 |
| 97. | Midland | 0.36% | 0.21%(+0.149)#97 | 0.28%(+0.084)#4,507 |
| 98. | Whitsett | 0.35% | 0.21%(+0.131)#98 | 0.28%(+0.066)#4,714 |
| 99. | Hendersonville | 0.34% | 0.21%(+0.130)#99 | 0.28%(+0.065)#4,725 |
| 100. | Laurel Park | 0.34% | 0.21%(+0.130)#100 | 0.28%(+0.065)#4,728 |
Common Questions
What are the Top 10 Cities with the Highest Percentage of Immigrants from Western Europe in North Carolina?
Top 10 Cities with the Highest Percentage of Immigrants from Western Europe in North Carolina are:
#1
4.41%
#2
4.30%
#3
3.19%
#4
2.45%
#5
2.38%
#6
2.29%
#7
2.03%
#8
2.02%
#9
1.63%
#10
1.60%
What city has the Highest Percentage of Immigrants from Western Europe in North Carolina?
Riegelwood has the Highest Percentage of Immigrants from Western Europe in North Carolina with 4.41%.
What is the Percentage of Immigrants from Western Europe in the State of North Carolina?
Percentage of Immigrants from Western Europe in North Carolina is 0.21%.
What is the Percentage of Immigrants from Western Europe in the United States?
Percentage of Immigrants from Western Europe in the United States is 0.28%.