Cities with the Highest Percentage of Immigrants from Western Europe in Ohio
RELATED REPORTS & OPTIONS
Western Europe
Ohio
Compare Cities
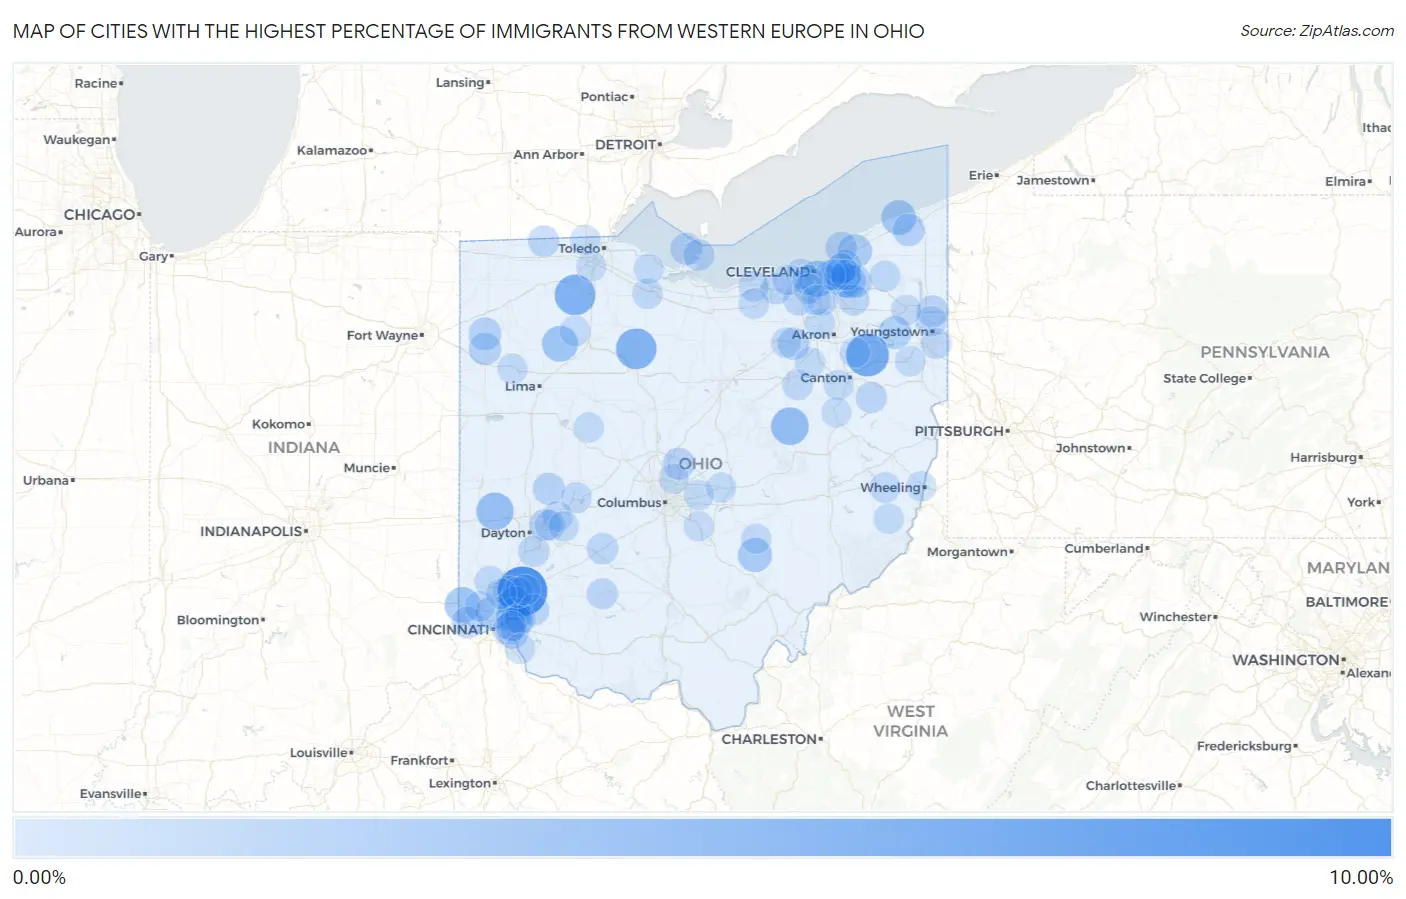
Map of Cities with the Highest Percentage of Immigrants from Western Europe in Ohio
0.00%
10.00%
Cities with the Highest Percentage of Immigrants from Western Europe in Ohio
| City | Western Europe | vs State | vs National | |
| 1. | Kings Mills | 8.02% | 0.17%(+7.85)#1 | 0.28%(+7.74)#55 |
| 2. | Bass Lake | 6.89% | 0.17%(+6.71)#2 | 0.28%(+6.61)#72 |
| 3. | Marlboro | 5.35% | 0.17%(+5.18)#3 | 0.28%(+5.07)#109 |
| 4. | Weston | 4.49% | 0.17%(+4.31)#4 | 0.28%(+4.21)#148 |
| 5. | Mccutchenville | 4.47% | 0.17%(+4.30)#5 | 0.28%(+4.19)#149 |
| 6. | Lake Buckhorn | 3.29% | 0.17%(+3.12)#6 | 0.28%(+3.01)#221 |
| 7. | Verona | 3.17% | 0.17%(+3.00)#7 | 0.28%(+2.89)#234 |
| 8. | Newburgh Heights | 2.78% | 0.17%(+2.61)#8 | 0.28%(+2.50)#290 |
| 9. | Gilboa | 2.61% | 0.17%(+2.44)#9 | 0.28%(+2.33)#333 |
| 10. | Harrison | 2.54% | 0.17%(+2.37)#10 | 0.28%(+2.27)#347 |
| 11. | Geneva On The Lake | 2.21% | 0.17%(+2.04)#11 | 0.28%(+1.93)#435 |
| 12. | Kingsville | 2.17% | 0.17%(+2.00)#12 | 0.28%(+1.89)#452 |
| 13. | Moreland Hills | 2.03% | 0.17%(+1.86)#13 | 0.28%(+1.76)#500 |
| 14. | Sixteen Mile Stand | 2.01% | 0.17%(+1.84)#14 | 0.28%(+1.73)#514 |
| 15. | The Village Of Indian Hill | 1.98% | 0.17%(+1.81)#15 | 0.28%(+1.70)#522 |
| 16. | Shawnee | 1.95% | 0.17%(+1.77)#16 | 0.28%(+1.67)#537 |
| 17. | Kirtland Hills | 1.92% | 0.17%(+1.74)#17 | 0.28%(+1.64)#549 |
| 18. | Chagrin Falls | 1.82% | 0.17%(+1.65)#18 | 0.28%(+1.54)#599 |
| 19. | Finneytown | 1.79% | 0.17%(+1.61)#19 | 0.28%(+1.51)#611 |
| 20. | Lake Milton | 1.49% | 0.17%(+1.32)#20 | 0.28%(+1.21)#802 |
| 21. | South Russell | 1.44% | 0.17%(+1.26)#21 | 0.28%(+1.16)#838 |
| 22. | Gates Mills | 1.44% | 0.17%(+1.26)#22 | 0.28%(+1.16)#840 |
| 23. | Latty | 1.38% | 0.17%(+1.21)#23 | 0.28%(+1.10)#896 |
| 24. | Scott | 1.33% | 0.17%(+1.15)#24 | 0.28%(+1.05)#951 |
| 25. | Terrace Park | 1.30% | 0.17%(+1.13)#25 | 0.28%(+1.02)#978 |
| 26. | Austinburg | 1.27% | 0.17%(+1.10)#26 | 0.28%(+0.992)#1,016 |
| 27. | Christiansburg | 1.18% | 0.17%(+1.01)#27 | 0.28%(+0.899)#1,131 |
| 28. | Galena | 1.16% | 0.17%(+0.989)#28 | 0.28%(+0.883)#1,158 |
| 29. | Seville | 1.16% | 0.17%(+0.988)#29 | 0.28%(+0.882)#1,159 |
| 30. | Put In Bay | 1.12% | 0.17%(+0.951)#30 | 0.28%(+0.844)#1,204 |
| 31. | Forestville | 1.11% | 0.17%(+0.937)#31 | 0.28%(+0.830)#1,225 |
| 32. | North Bend | 1.09% | 0.17%(+0.921)#32 | 0.28%(+0.814)#1,250 |
| 33. | Vienna Center | 1.08% | 0.17%(+0.903)#33 | 0.28%(+0.796)#1,280 |
| 34. | Beachwood | 1.04% | 0.17%(+0.867)#34 | 0.28%(+0.761)#1,354 |
| 35. | Wright Patterson Afb | 1.03% | 0.17%(+0.857)#35 | 0.28%(+0.750)#1,376 |
| 36. | Turpin Hills | 1.01% | 0.17%(+0.839)#36 | 0.28%(+0.733)#1,407 |
| 37. | Lakeline | 1.01% | 0.17%(+0.837)#37 | 0.28%(+0.731)#1,411 |
| 38. | North Industry | 1.01% | 0.17%(+0.836)#38 | 0.28%(+0.729)#1,412 |
| 39. | Jeffersonville | 0.92% | 0.17%(+0.749)#39 | 0.28%(+0.642)#1,597 |
| 40. | Kelleys Island | 0.90% | 0.17%(+0.732)#40 | 0.28%(+0.626)#1,644 |
| 41. | Lyons | 0.89% | 0.17%(+0.719)#41 | 0.28%(+0.612)#1,679 |
| 42. | Centerville | 0.84% | 0.17%(+0.668)#42 | 0.28%(+0.561)#1,811 |
| 43. | Strongsville | 0.83% | 0.17%(+0.659)#43 | 0.28%(+0.553)#1,833 |
| 44. | Lake Mohawk | 0.81% | 0.17%(+0.641)#44 | 0.28%(+0.535)#1,881 |
| 45. | Pepper Pike | 0.81% | 0.17%(+0.639)#45 | 0.28%(+0.532)#1,889 |
| 46. | North Ridgeville | 0.81% | 0.17%(+0.633)#46 | 0.28%(+0.527)#1,905 |
| 47. | Goshen | 0.79% | 0.17%(+0.621)#47 | 0.28%(+0.514)#1,949 |
| 48. | Leesburg | 0.79% | 0.17%(+0.615)#48 | 0.28%(+0.508)#1,965 |
| 49. | Milford | 0.78% | 0.17%(+0.605)#49 | 0.28%(+0.499)#1,998 |
| 50. | Aurora | 0.74% | 0.17%(+0.570)#50 | 0.28%(+0.464)#2,105 |
| 51. | Brecksville | 0.73% | 0.17%(+0.562)#51 | 0.28%(+0.455)#2,142 |
| 52. | Northridge | 0.73% | 0.17%(+0.557)#52 | 0.28%(+0.450)#2,164 |
| 53. | Wetherington | 0.73% | 0.17%(+0.555)#53 | 0.28%(+0.448)#2,179 |
| 54. | Middlefield | 0.73% | 0.17%(+0.553)#54 | 0.28%(+0.447)#2,181 |
| 55. | Morristown | 0.72% | 0.17%(+0.549)#55 | 0.28%(+0.443)#2,196 |
| 56. | Mayfield Heights | 0.72% | 0.17%(+0.548)#56 | 0.28%(+0.441)#2,202 |
| 57. | Mason | 0.69% | 0.17%(+0.515)#57 | 0.28%(+0.408)#2,303 |
| 58. | New Miami | 0.66% | 0.17%(+0.491)#58 | 0.28%(+0.384)#2,408 |
| 59. | Dry Ridge | 0.65% | 0.17%(+0.482)#59 | 0.28%(+0.375)#2,447 |
| 60. | South Lebanon | 0.64% | 0.17%(+0.470)#60 | 0.28%(+0.364)#2,508 |
| 61. | Apple Creek | 0.64% | 0.17%(+0.470)#61 | 0.28%(+0.364)#2,511 |
| 62. | Green Meadows | 0.64% | 0.17%(+0.466)#62 | 0.28%(+0.360)#2,533 |
| 63. | Stony Prairie | 0.64% | 0.17%(+0.465)#63 | 0.28%(+0.358)#2,538 |
| 64. | Newtown | 0.63% | 0.17%(+0.459)#64 | 0.28%(+0.352)#2,570 |
| 65. | Hunting Valley | 0.63% | 0.17%(+0.452)#65 | 0.28%(+0.346)#2,609 |
| 66. | Poland | 0.62% | 0.17%(+0.449)#66 | 0.28%(+0.343)#2,620 |
| 67. | Amherst | 0.62% | 0.17%(+0.447)#67 | 0.28%(+0.341)#2,629 |
| 68. | Fairborn | 0.62% | 0.17%(+0.445)#68 | 0.28%(+0.338)#2,642 |
| 69. | Churchill | 0.61% | 0.17%(+0.442)#69 | 0.28%(+0.335)#2,665 |
| 70. | Rushsylvania | 0.59% | 0.17%(+0.414)#70 | 0.28%(+0.308)#2,810 |
| 71. | Beckett Ridge | 0.59% | 0.17%(+0.414)#71 | 0.28%(+0.308)#2,811 |
| 72. | Salem | 0.58% | 0.17%(+0.409)#72 | 0.28%(+0.302)#2,839 |
| 73. | Lakewood | 0.58% | 0.17%(+0.402)#73 | 0.28%(+0.296)#2,867 |
| 74. | Mccomb | 0.57% | 0.17%(+0.402)#74 | 0.28%(+0.295)#2,869 |
| 75. | Oberlin | 0.57% | 0.17%(+0.401)#75 | 0.28%(+0.294)#2,872 |
| 76. | Shaker Heights | 0.57% | 0.17%(+0.393)#76 | 0.28%(+0.287)#2,922 |
| 77. | Montrose Ghent | 0.56% | 0.17%(+0.391)#77 | 0.28%(+0.284)#2,933 |
| 78. | Delphos | 0.56% | 0.17%(+0.386)#78 | 0.28%(+0.280)#2,956 |
| 79. | Bridgeport | 0.55% | 0.17%(+0.379)#79 | 0.28%(+0.273)#2,992 |
| 80. | New Richmond | 0.55% | 0.17%(+0.376)#80 | 0.28%(+0.270)#3,008 |
| 81. | Westlake | 0.55% | 0.17%(+0.374)#81 | 0.28%(+0.267)#3,021 |
| 82. | Leavittsburg | 0.54% | 0.17%(+0.365)#82 | 0.28%(+0.258)#3,081 |
| 83. | Westfield Center | 0.53% | 0.17%(+0.361)#83 | 0.28%(+0.254)#3,105 |
| 84. | Granville | 0.52% | 0.17%(+0.346)#84 | 0.28%(+0.240)#3,192 |
| 85. | Marshallville | 0.52% | 0.17%(+0.343)#85 | 0.28%(+0.236)#3,216 |
| 86. | Hartville | 0.51% | 0.17%(+0.340)#86 | 0.28%(+0.233)#3,236 |
| 87. | Beallsville | 0.51% | 0.17%(+0.337)#87 | 0.28%(+0.231)#3,251 |
| 88. | Yellow Springs | 0.51% | 0.17%(+0.335)#88 | 0.28%(+0.229)#3,266 |
| 89. | Brooklyn | 0.50% | 0.17%(+0.325)#89 | 0.28%(+0.218)#3,347 |
| 90. | Richville | 0.50% | 0.17%(+0.323)#90 | 0.28%(+0.217)#3,354 |
| 91. | New Lexington | 0.48% | 0.17%(+0.308)#91 | 0.28%(+0.201)#3,464 |
| 92. | Pataskala | 0.48% | 0.17%(+0.304)#92 | 0.28%(+0.197)#3,494 |
| 93. | Oak Harbor | 0.48% | 0.17%(+0.303)#93 | 0.28%(+0.197)#3,498 |
| 94. | Parma | 0.45% | 0.17%(+0.279)#94 | 0.28%(+0.172)#3,674 |
| 95. | Carroll | 0.45% | 0.17%(+0.279)#95 | 0.28%(+0.172)#3,677 |
| 96. | Perrysburg | 0.45% | 0.17%(+0.278)#96 | 0.28%(+0.171)#3,679 |
| 97. | Parral | 0.45% | 0.17%(+0.276)#97 | 0.28%(+0.169)#3,698 |
| 98. | Broadview Heights | 0.44% | 0.17%(+0.271)#98 | 0.28%(+0.165)#3,732 |
| 99. | Westerville | 0.44% | 0.17%(+0.269)#99 | 0.28%(+0.163)#3,750 |
| 100. | Sylvania | 0.44% | 0.17%(+0.268)#100 | 0.28%(+0.162)#3,762 |
Common Questions
What are the Top 10 Cities with the Highest Percentage of Immigrants from Western Europe in Ohio?
Top 10 Cities with the Highest Percentage of Immigrants from Western Europe in Ohio are:
#1
8.02%
#2
5.35%
#3
4.49%
#4
4.47%
#5
3.29%
#6
3.17%
#7
2.78%
#8
2.61%
#9
2.54%
#10
2.21%
What city has the Highest Percentage of Immigrants from Western Europe in Ohio?
Kings Mills has the Highest Percentage of Immigrants from Western Europe in Ohio with 8.02%.
What is the Percentage of Immigrants from Western Europe in the State of Ohio?
Percentage of Immigrants from Western Europe in Ohio is 0.17%.
What is the Percentage of Immigrants from Western Europe in the United States?
Percentage of Immigrants from Western Europe in the United States is 0.28%.