Cities with the Highest Percentage of Immigrants from Western Europe in Pennsylvania
RELATED REPORTS & OPTIONS
Western Europe
Pennsylvania
Compare Cities
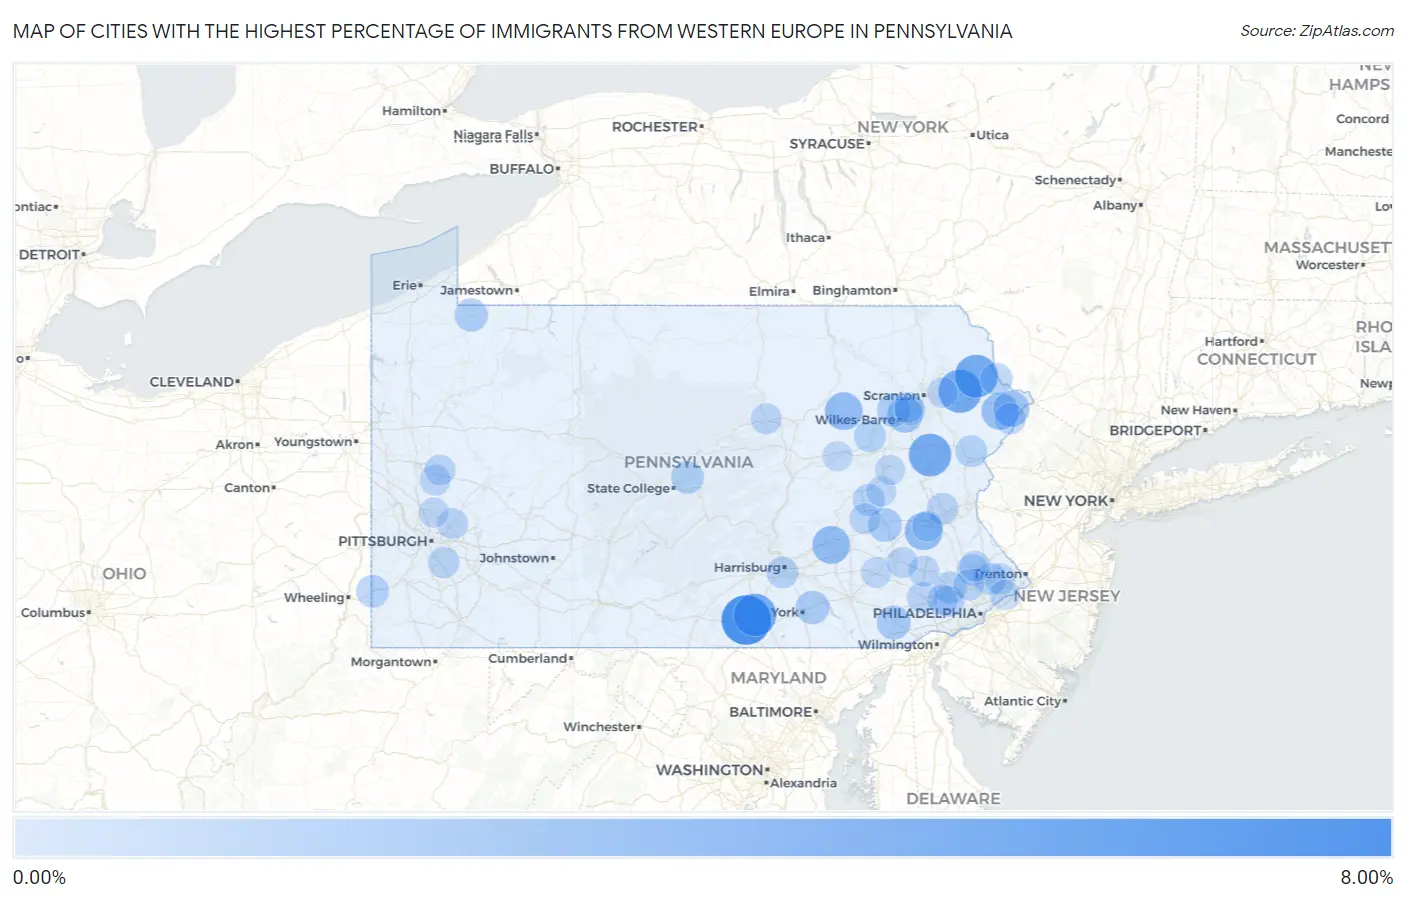
Map of Cities with the Highest Percentage of Immigrants from Western Europe in Pennsylvania
0.00%
8.00%
Cities with the Highest Percentage of Immigrants from Western Europe in Pennsylvania
| City | Western Europe | vs State | vs National | |
| 1. | Table Rock | 7.00% | 0.21%(+6.79)#1 | 0.28%(+6.72)#69 |
| 2. | The Hideout | 4.88% | 0.21%(+4.67)#2 | 0.28%(+4.60)#129 |
| 3. | White Mills | 4.83% | 0.21%(+4.62)#3 | 0.28%(+4.55)#133 |
| 4. | Heidlersburg | 4.67% | 0.21%(+4.46)#4 | 0.28%(+4.39)#138 |
| 5. | Albrightsville | 4.64% | 0.21%(+4.43)#5 | 0.28%(+4.36)#139 |
| 6. | Loretto Borough | 3.34% | 0.21%(+3.13)#6 | 0.28%(+3.06)#215 |
| 7. | Mount Pocono Borough | 3.32% | 0.21%(+3.12)#7 | 0.28%(+3.05)#219 |
| 8. | Mertztown | 3.15% | 0.21%(+2.94)#8 | 0.28%(+2.87)#238 |
| 9. | Jonestown | 3.12% | 0.21%(+2.92)#9 | 0.28%(+2.85)#244 |
| 10. | Casselman Borough | 3.12% | 0.21%(+2.92)#10 | 0.28%(+2.85)#245 |
| 11. | Jamison City | 3.07% | 0.21%(+2.86)#11 | 0.28%(+2.79)#249 |
| 12. | Sewickley Heights Borough | 3.02% | 0.21%(+2.81)#12 | 0.28%(+2.74)#255 |
| 13. | Conashaugh Lakes | 2.84% | 0.21%(+2.63)#13 | 0.28%(+2.56)#282 |
| 14. | Carlisle Barracks | 2.74% | 0.21%(+2.53)#14 | 0.28%(+2.47)#302 |
| 15. | Morea | 2.73% | 0.21%(+2.52)#15 | 0.28%(+2.45)#305 |
| 16. | Pocono Woodland Lakes | 2.56% | 0.21%(+2.36)#16 | 0.28%(+2.29)#340 |
| 17. | Hudson | 2.39% | 0.21%(+2.18)#17 | 0.28%(+2.11)#375 |
| 18. | New Boston | 2.10% | 0.21%(+1.89)#18 | 0.28%(+1.82)#472 |
| 19. | Avoca Borough | 2.06% | 0.21%(+1.85)#19 | 0.28%(+1.78)#492 |
| 20. | Bala Cynwyd | 1.98% | 0.21%(+1.77)#20 | 0.28%(+1.71)#520 |
| 21. | Barkeyville Borough | 1.98% | 0.21%(+1.77)#21 | 0.28%(+1.70)#521 |
| 22. | Cochranville | 1.84% | 0.21%(+1.63)#22 | 0.28%(+1.56)#579 |
| 23. | Middleport Borough | 1.80% | 0.21%(+1.59)#23 | 0.28%(+1.52)#605 |
| 24. | Narberth Borough | 1.79% | 0.21%(+1.58)#24 | 0.28%(+1.51)#613 |
| 25. | Laurel Run Borough | 1.78% | 0.21%(+1.57)#25 | 0.28%(+1.50)#615 |
| 26. | West Hamburg | 1.78% | 0.21%(+1.57)#26 | 0.28%(+1.50)#618 |
| 27. | Yorklyn | 1.77% | 0.21%(+1.56)#27 | 0.28%(+1.49)#623 |
| 28. | Wayne | 1.76% | 0.21%(+1.55)#28 | 0.28%(+1.48)#626 |
| 29. | Harveys Lake Borough | 1.72% | 0.21%(+1.51)#29 | 0.28%(+1.44)#644 |
| 30. | Trucksville | 1.68% | 0.21%(+1.47)#30 | 0.28%(+1.40)#675 |
| 31. | Corry | 1.67% | 0.21%(+1.47)#31 | 0.28%(+1.40)#676 |
| 32. | Bradford Woods Borough | 1.54% | 0.21%(+1.33)#32 | 0.28%(+1.26)#768 |
| 33. | Pleasant Gap | 1.47% | 0.21%(+1.26)#33 | 0.28%(+1.19)#813 |
| 34. | Austin Borough | 1.45% | 0.21%(+1.24)#34 | 0.28%(+1.17)#833 |
| 35. | Creekside Borough | 1.44% | 0.21%(+1.23)#35 | 0.28%(+1.16)#837 |
| 36. | West Alexander | 1.43% | 0.21%(+1.22)#36 | 0.28%(+1.15)#848 |
| 37. | Elderton Borough | 1.43% | 0.21%(+1.22)#37 | 0.28%(+1.15)#849 |
| 38. | East Stroudsburg Borough | 1.42% | 0.21%(+1.21)#38 | 0.28%(+1.14)#855 |
| 39. | Clifton Heights Borough | 1.39% | 0.21%(+1.18)#39 | 0.28%(+1.11)#881 |
| 40. | Honesdale Borough | 1.34% | 0.21%(+1.13)#40 | 0.28%(+1.06)#930 |
| 41. | Masthope | 1.34% | 0.21%(+1.13)#41 | 0.28%(+1.06)#935 |
| 42. | Clarks Summit Borough | 1.34% | 0.21%(+1.13)#42 | 0.28%(+1.06)#939 |
| 43. | Mocanaqua | 1.31% | 0.21%(+1.10)#43 | 0.28%(+1.03)#971 |
| 44. | Newburg Borough Cumberland County | 1.30% | 0.21%(+1.09)#44 | 0.28%(+1.02)#985 |
| 45. | Audubon | 1.26% | 0.21%(+1.05)#45 | 0.28%(+0.979)#1,031 |
| 46. | Penn Estates | 1.24% | 0.21%(+1.03)#46 | 0.28%(+0.962)#1,042 |
| 47. | Cumbola | 1.23% | 0.21%(+1.02)#47 | 0.28%(+0.950)#1,058 |
| 48. | Starrucca Borough | 1.22% | 0.21%(+1.01)#48 | 0.28%(+0.940)#1,066 |
| 49. | Warminster Heights | 1.21% | 0.21%(+1.00)#49 | 0.28%(+0.931)#1,076 |
| 50. | Lower Allen | 1.13% | 0.21%(+0.920)#50 | 0.28%(+0.850)#1,198 |
| 51. | Mercersburg Borough | 1.10% | 0.21%(+0.895)#51 | 0.28%(+0.825)#1,237 |
| 52. | Hummelstown Borough | 1.10% | 0.21%(+0.893)#52 | 0.28%(+0.823)#1,241 |
| 53. | Montgomeryville | 1.10% | 0.21%(+0.890)#53 | 0.28%(+0.820)#1,243 |
| 54. | Hokendauqua | 1.08% | 0.21%(+0.872)#54 | 0.28%(+0.802)#1,272 |
| 55. | Marianna Borough | 1.08% | 0.21%(+0.866)#55 | 0.28%(+0.796)#1,281 |
| 56. | Bridgeville Borough | 1.07% | 0.21%(+0.858)#56 | 0.28%(+0.788)#1,297 |
| 57. | Canton Borough | 1.06% | 0.21%(+0.851)#57 | 0.28%(+0.782)#1,310 |
| 58. | Wyomissing Borough | 1.05% | 0.21%(+0.839)#58 | 0.28%(+0.769)#1,330 |
| 59. | Petersburg Borough | 1.04% | 0.21%(+0.835)#59 | 0.28%(+0.765)#1,339 |
| 60. | Conyngham Borough | 1.04% | 0.21%(+0.829)#60 | 0.28%(+0.759)#1,356 |
| 61. | North Bend | 1.04% | 0.21%(+0.829)#61 | 0.28%(+0.759)#1,357 |
| 62. | Clairton | 1.04% | 0.21%(+0.826)#62 | 0.28%(+0.756)#1,361 |
| 63. | Berwyn | 1.03% | 0.21%(+0.818)#63 | 0.28%(+0.748)#1,382 |
| 64. | Jermyn Borough | 1.01% | 0.21%(+0.805)#64 | 0.28%(+0.735)#1,403 |
| 65. | Birchwood Lakes | 1.00% | 0.21%(+0.790)#65 | 0.28%(+0.721)#1,433 |
| 66. | Hayti | 0.97% | 0.21%(+0.764)#66 | 0.28%(+0.694)#1,484 |
| 67. | Lake Wynonah | 0.94% | 0.21%(+0.732)#67 | 0.28%(+0.662)#1,551 |
| 68. | Eagleview | 0.94% | 0.21%(+0.730)#68 | 0.28%(+0.660)#1,558 |
| 69. | Blue Bell | 0.93% | 0.21%(+0.724)#69 | 0.28%(+0.654)#1,568 |
| 70. | Meridian | 0.93% | 0.21%(+0.724)#70 | 0.28%(+0.654)#1,569 |
| 71. | Harwick | 0.93% | 0.21%(+0.719)#71 | 0.28%(+0.649)#1,577 |
| 72. | Churchville | 0.93% | 0.21%(+0.717)#72 | 0.28%(+0.648)#1,582 |
| 73. | South Pottstown | 0.92% | 0.21%(+0.714)#73 | 0.28%(+0.645)#1,590 |
| 74. | Aldan Borough | 0.92% | 0.21%(+0.713)#74 | 0.28%(+0.644)#1,593 |
| 75. | Lorane | 0.92% | 0.21%(+0.707)#75 | 0.28%(+0.637)#1,612 |
| 76. | Garden View | 0.90% | 0.21%(+0.695)#76 | 0.28%(+0.625)#1,648 |
| 77. | Shanor Northvue | 0.89% | 0.21%(+0.684)#77 | 0.28%(+0.614)#1,674 |
| 78. | Bath Borough | 0.89% | 0.21%(+0.679)#78 | 0.28%(+0.609)#1,691 |
| 79. | Browntown | 0.88% | 0.21%(+0.671)#79 | 0.28%(+0.601)#1,712 |
| 80. | Bell Acres Borough | 0.87% | 0.21%(+0.657)#80 | 0.28%(+0.588)#1,747 |
| 81. | Brittany Farms The Highlands | 0.86% | 0.21%(+0.654)#81 | 0.28%(+0.584)#1,759 |
| 82. | Swartzville | 0.85% | 0.21%(+0.643)#82 | 0.28%(+0.573)#1,777 |
| 83. | Paoli | 0.85% | 0.21%(+0.640)#83 | 0.28%(+0.570)#1,785 |
| 84. | Blossburg Borough | 0.82% | 0.21%(+0.608)#84 | 0.28%(+0.538)#1,870 |
| 85. | Cornwall Borough | 0.81% | 0.21%(+0.599)#85 | 0.28%(+0.529)#1,896 |
| 86. | Breinigsville | 0.81% | 0.21%(+0.598)#86 | 0.28%(+0.529)#1,898 |
| 87. | Swarthmore Borough | 0.80% | 0.21%(+0.590)#87 | 0.28%(+0.520)#1,929 |
| 88. | Halifax Borough | 0.79% | 0.21%(+0.584)#88 | 0.28%(+0.514)#1,950 |
| 89. | Shoemakersville Borough | 0.77% | 0.21%(+0.561)#89 | 0.28%(+0.492)#2,018 |
| 90. | Woodcock Borough | 0.76% | 0.21%(+0.548)#90 | 0.28%(+0.478)#2,065 |
| 91. | Cornwells Heights | 0.75% | 0.21%(+0.537)#91 | 0.28%(+0.468)#2,089 |
| 92. | Tuscarora | 0.74% | 0.21%(+0.533)#92 | 0.28%(+0.463)#2,108 |
| 93. | Lemoyne Borough | 0.73% | 0.21%(+0.520)#93 | 0.28%(+0.450)#2,170 |
| 94. | Pittston | 0.72% | 0.21%(+0.514)#94 | 0.28%(+0.444)#2,193 |
| 95. | Mount Cobb | 0.70% | 0.21%(+0.495)#95 | 0.28%(+0.425)#2,252 |
| 96. | Espy | 0.70% | 0.21%(+0.492)#96 | 0.28%(+0.422)#2,260 |
| 97. | Gibsonia | 0.70% | 0.21%(+0.486)#97 | 0.28%(+0.416)#2,273 |
| 98. | Tresckow | 0.69% | 0.21%(+0.484)#98 | 0.28%(+0.414)#2,285 |
| 99. | Delmont Borough | 0.69% | 0.21%(+0.477)#99 | 0.28%(+0.407)#2,307 |
| 100. | Denver Borough | 0.69% | 0.21%(+0.477)#100 | 0.28%(+0.407)#2,309 |
Common Questions
What are the Top 10 Cities with the Highest Percentage of Immigrants from Western Europe in Pennsylvania?
Top 10 Cities with the Highest Percentage of Immigrants from Western Europe in Pennsylvania are:
#1
7.00%
#2
4.88%
#3
4.83%
#4
4.67%
#5
4.64%
#6
3.15%
#7
3.12%
#8
3.07%
#9
2.84%
#10
2.56%
What city has the Highest Percentage of Immigrants from Western Europe in Pennsylvania?
Table Rock has the Highest Percentage of Immigrants from Western Europe in Pennsylvania with 7.00%.
What is the Percentage of Immigrants from Western Europe in the State of Pennsylvania?
Percentage of Immigrants from Western Europe in Pennsylvania is 0.21%.
What is the Percentage of Immigrants from Western Europe in the United States?
Percentage of Immigrants from Western Europe in the United States is 0.28%.