Zip Codes with the Highest Percentage of Households Heated by Bottled Gas / Liquid Propane in Puyallup, WA
RELATED REPORTS & OPTIONS
Bottled Gas / LP Heating
Puyallup
Compare Zip Codes
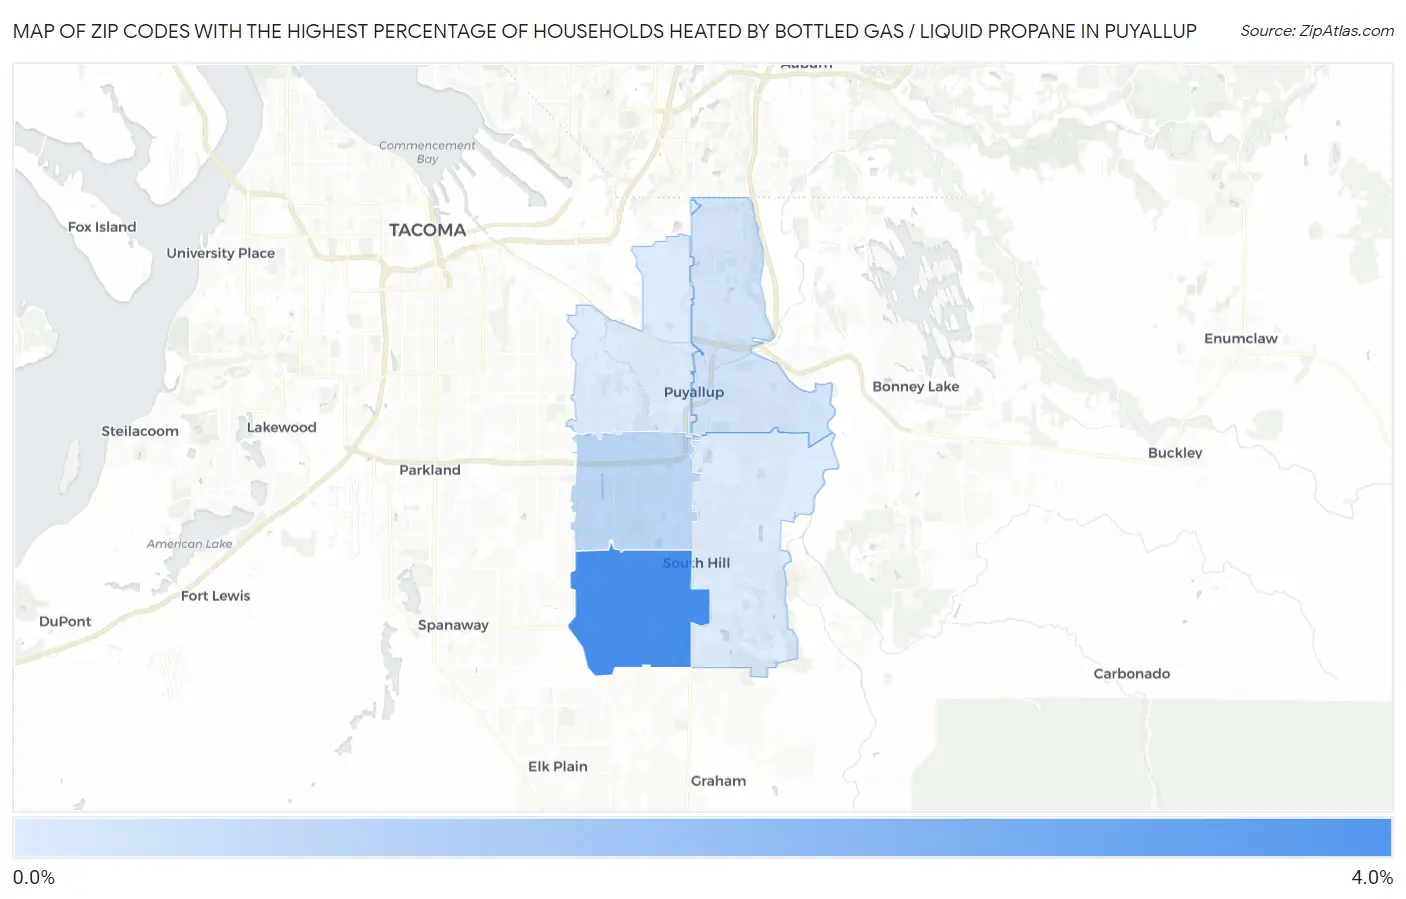
Map of Zip Codes with the Highest Percentage of Households Heated by Bottled Gas / Liquid Propane in Puyallup
0.90%
3.7%
Zip Codes with the Highest Percentage of Households Heated by Bottled Gas / Liquid Propane in Puyallup, WA
| Zip Code | Bottled Gas / LP Heating | vs State | vs National | |
| 1. | 98375 | 3.7% | 3.1%(+0.600)#221 | 4.9%(-1.20)#19,974 |
| 2. | 98373 | 1.5% | 3.1%(-1.60)#349 | 4.9%(-3.40)#24,732 |
| 3. | 98372 | 1.1% | 3.1%(-2.00)#390 | 4.9%(-3.80)#26,283 |
| 4. | 98374 | 0.90% | 3.1%(-2.20)#423 | 4.9%(-4.00)#26,988 |
| 5. | 98371 | 0.90% | 3.1%(-2.20)#427 | 4.9%(-4.00)#27,154 |
1
Common Questions
What are the Top 3 Zip Codes with the Highest Percentage of Households Heated by Bottled Gas / Liquid Propane in Puyallup, WA?
Top 3 Zip Codes with the Highest Percentage of Households Heated by Bottled Gas / Liquid Propane in Puyallup, WA are:
What zip code has the Highest Percentage of Households Heated by Bottled Gas / Liquid Propane in Puyallup, WA?
98375 has the Highest Percentage of Households Heated by Bottled Gas / Liquid Propane in Puyallup, WA with 3.7%.
What is the Percentage of Households Heated by Bottled Gas / Liquid Propane in Puyallup, WA?
Percentage of Households Heated by Bottled Gas / Liquid Propane in Puyallup is 0.60%.
What is the Percentage of Households Heated by Bottled Gas / Liquid Propane in Washington?
Percentage of Households Heated by Bottled Gas / Liquid Propane in Washington is 3.1%.
What is the Percentage of Households Heated by Bottled Gas / Liquid Propane in the United States?
Percentage of Households Heated by Bottled Gas / Liquid Propane in the United States is 4.9%.