Zip Codes with the Highest Percentage of Households Heated by Bottled Gas / Liquid Propane in Seattle, WA
RELATED REPORTS & OPTIONS
Bottled Gas / LP Heating
Seattle
Compare Zip Codes
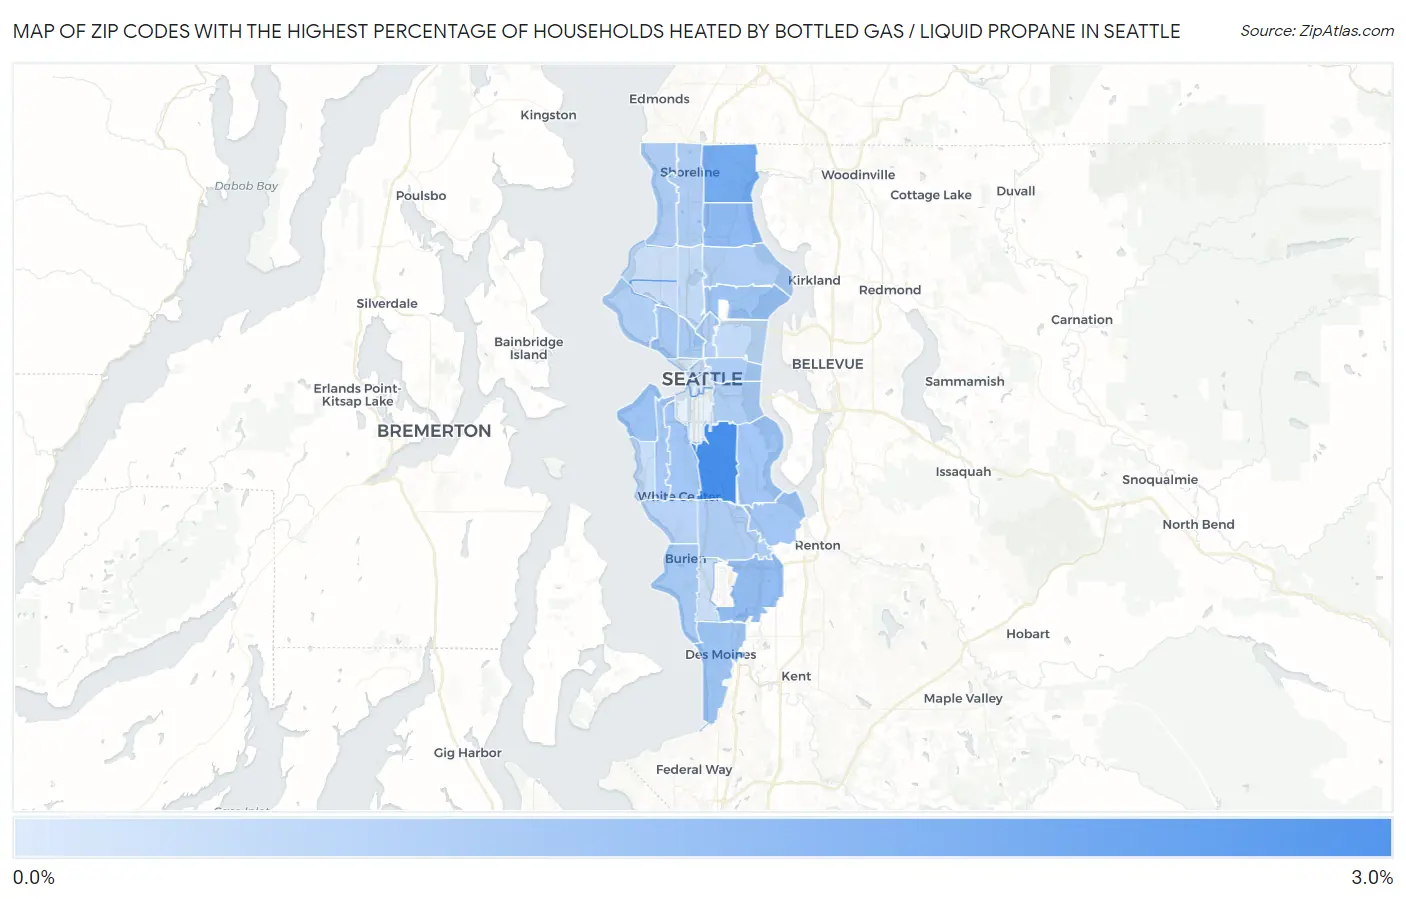
Map of Zip Codes with the Highest Percentage of Households Heated by Bottled Gas / Liquid Propane in Seattle
0.10%
3.0%
Zip Codes with the Highest Percentage of Households Heated by Bottled Gas / Liquid Propane in Seattle, WA
| Zip Code | Bottled Gas / LP Heating | vs State | vs National | |
| 1. | 98108 | 3.0% | 3.1%(-0.100)#249 | 4.9%(-1.90)#21,025 |
| 2. | 98155 | 2.1% | 3.1%(-1.000)#294 | 4.9%(-2.80)#22,858 |
| 3. | 98125 | 1.6% | 3.1%(-1.50)#336 | 4.9%(-3.30)#24,303 |
| 4. | 98188 | 1.5% | 3.1%(-1.60)#350 | 4.9%(-3.40)#24,749 |
| 5. | 98105 | 1.3% | 3.1%(-1.80)#363 | 4.9%(-3.60)#25,362 |
| 6. | 98198 | 1.3% | 3.1%(-1.80)#366 | 4.9%(-3.60)#25,402 |
| 7. | 98116 | 1.3% | 3.1%(-1.80)#367 | 4.9%(-3.60)#25,489 |
| 8. | 98118 | 1.2% | 3.1%(-1.90)#372 | 4.9%(-3.70)#25,762 |
| 9. | 98106 | 1.2% | 3.1%(-1.90)#375 | 4.9%(-3.70)#25,882 |
| 10. | 98178 | 1.2% | 3.1%(-1.90)#376 | 4.9%(-3.70)#25,894 |
| 11. | 98109 | 1.1% | 3.1%(-2.00)#388 | 4.9%(-3.80)#26,237 |
| 12. | 98119 | 1.1% | 3.1%(-2.00)#391 | 4.9%(-3.80)#26,290 |
| 13. | 98166 | 1.1% | 3.1%(-2.00)#393 | 4.9%(-3.80)#26,310 |
| 14. | 98126 | 1.1% | 3.1%(-2.00)#394 | 4.9%(-3.80)#26,317 |
| 15. | 98115 | 1.0% | 3.1%(-2.10)#401 | 4.9%(-3.90)#26,538 |
| 16. | 98133 | 1.0% | 3.1%(-2.10)#402 | 4.9%(-3.90)#26,547 |
| 17. | 98122 | 1.0% | 3.1%(-2.10)#404 | 4.9%(-3.90)#26,571 |
| 18. | 98168 | 1.0% | 3.1%(-2.10)#407 | 4.9%(-3.90)#26,618 |
| 19. | 98144 | 1.0% | 3.1%(-2.10)#409 | 4.9%(-3.90)#26,635 |
| 20. | 98177 | 1.0% | 3.1%(-2.10)#413 | 4.9%(-3.90)#26,752 |
| 21. | 98102 | 0.90% | 3.1%(-2.20)#426 | 4.9%(-4.00)#27,126 |
| 22. | 98199 | 0.90% | 3.1%(-2.20)#428 | 4.9%(-4.00)#27,158 |
| 23. | 98146 | 0.80% | 3.1%(-2.30)#435 | 4.9%(-4.10)#27,509 |
| 24. | 98103 | 0.60% | 3.1%(-2.50)#452 | 4.9%(-4.30)#28,127 |
| 25. | 98112 | 0.60% | 3.1%(-2.50)#459 | 4.9%(-4.30)#28,291 |
| 26. | 98101 | 0.60% | 3.1%(-2.50)#461 | 4.9%(-4.30)#28,344 |
| 27. | 98107 | 0.50% | 3.1%(-2.60)#468 | 4.9%(-4.40)#28,586 |
| 28. | 98136 | 0.50% | 3.1%(-2.60)#471 | 4.9%(-4.40)#28,673 |
| 29. | 98117 | 0.40% | 3.1%(-2.70)#476 | 4.9%(-4.50)#28,867 |
| 30. | 98148 | 0.40% | 3.1%(-2.70)#480 | 4.9%(-4.50)#29,011 |
| 31. | 98121 | 0.10% | 3.1%(-3.00)#492 | 4.9%(-4.80)#29,574 |
| 32. | 98104 | 0.10% | 3.1%(-3.00)#493 | 4.9%(-4.80)#29,583 |
1
Common Questions
What are the Top 10 Zip Codes with the Highest Percentage of Households Heated by Bottled Gas / Liquid Propane in Seattle, WA?
Top 10 Zip Codes with the Highest Percentage of Households Heated by Bottled Gas / Liquid Propane in Seattle, WA are:
What zip code has the Highest Percentage of Households Heated by Bottled Gas / Liquid Propane in Seattle, WA?
98108 has the Highest Percentage of Households Heated by Bottled Gas / Liquid Propane in Seattle, WA with 3.0%.
What is the Percentage of Households Heated by Bottled Gas / Liquid Propane in Seattle, WA?
Percentage of Households Heated by Bottled Gas / Liquid Propane in Seattle is 1.0%.
What is the Percentage of Households Heated by Bottled Gas / Liquid Propane in Washington?
Percentage of Households Heated by Bottled Gas / Liquid Propane in Washington is 3.1%.
What is the Percentage of Households Heated by Bottled Gas / Liquid Propane in the United States?
Percentage of Households Heated by Bottled Gas / Liquid Propane in the United States is 4.9%.