Cities with the Highest Percentage of Households Heated by Bottled Gas / Liquid Propane in Delaware
RELATED REPORTS & OPTIONS
Bottled Gas / LP Heating
Delaware
Compare Cities
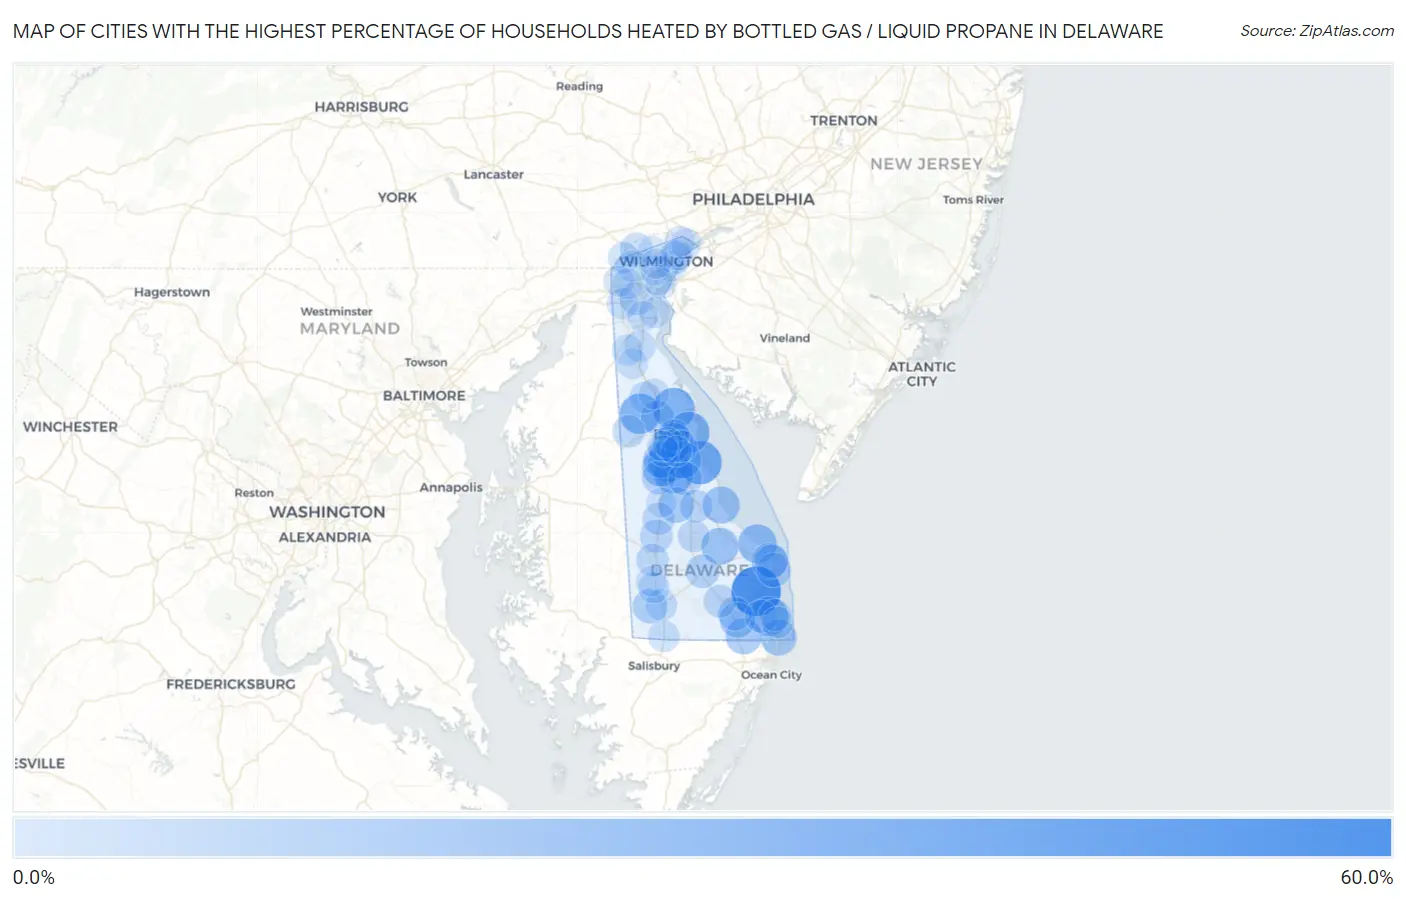
Map of Cities with the Highest Percentage of Households Heated by Bottled Gas / Liquid Propane in Delaware
0.0%
60.0%
Cities with the Highest Percentage of Households Heated by Bottled Gas / Liquid Propane in Delaware
| City | Bottled Gas / LP Heating | vs State | vs National | |
| 1. | Long Neck | 55.6% | 9.2%(+46.4)#1 | 4.9%(+50.7)#2,013 |
| 2. | Bowers | 38.2% | 9.2%(+29.0)#2 | 4.9%(+33.3)#3,393 |
| 3. | Leipsic | 32.9% | 9.2%(+23.7)#3 | 4.9%(+28.0)#3,903 |
| 4. | Little Creek | 32.3% | 9.2%(+23.1)#4 | 4.9%(+27.4)#3,966 |
| 5. | Woodside East | 30.1% | 9.2%(+20.9)#5 | 4.9%(+25.2)#4,209 |
| 6. | Kenton | 29.5% | 9.2%(+20.3)#6 | 4.9%(+24.6)#4,285 |
| 7. | Riverview | 26.3% | 9.2%(+17.1)#7 | 4.9%(+21.4)#4,704 |
| 8. | Kent Acres | 25.4% | 9.2%(+16.2)#8 | 4.9%(+20.5)#4,836 |
| 9. | Ocean View | 25.3% | 9.2%(+16.1)#9 | 4.9%(+20.4)#4,849 |
| 10. | Lewes | 24.4% | 9.2%(+15.2)#10 | 4.9%(+19.5)#4,992 |
| 11. | Viola | 22.6% | 9.2%(+13.4)#11 | 4.9%(+17.7)#5,256 |
| 12. | Magnolia | 20.2% | 9.2%(+11.0)#12 | 4.9%(+15.3)#5,654 |
| 13. | Slaughter Beach | 19.9% | 9.2%(+10.7)#13 | 4.9%(+15.0)#5,724 |
| 14. | Milton | 19.4% | 9.2%(+10.2)#14 | 4.9%(+14.5)#5,791 |
| 15. | Rehoboth Beach | 17.8% | 9.2%(+8.60)#15 | 4.9%(+12.9)#6,118 |
| 16. | Fenwick Island | 16.8% | 9.2%(+7.60)#16 | 4.9%(+11.9)#6,352 |
| 17. | Woodside | 16.7% | 9.2%(+7.50)#17 | 4.9%(+11.8)#6,373 |
| 18. | Selbyville | 16.5% | 9.2%(+7.30)#18 | 4.9%(+11.6)#6,414 |
| 19. | Houston | 15.4% | 9.2%(+6.20)#19 | 4.9%(+10.5)#6,682 |
| 20. | Frankford | 14.7% | 9.2%(+5.50)#20 | 4.9%(+9.80)#6,851 |
| 21. | Lincoln | 13.5% | 9.2%(+4.30)#21 | 4.9%(+8.60)#7,131 |
| 22. | Bethel | 12.3% | 9.2%(+3.10)#22 | 4.9%(+7.40)#7,503 |
| 23. | Dewey Beach | 11.9% | 9.2%(+2.70)#23 | 4.9%(+7.00)#7,644 |
| 24. | Cheswold | 10.8% | 9.2%(+1.60)#24 | 4.9%(+5.90)#7,998 |
| 25. | Dagsboro | 10.2% | 9.2%(+1.000)#25 | 4.9%(+5.30)#8,209 |
| 26. | Georgetown | 9.9% | 9.2%(+0.700)#26 | 4.9%(+5.00)#8,325 |
| 27. | Felton | 9.5% | 9.2%(+0.300)#27 | 4.9%(+4.60)#8,506 |
| 28. | Frederica | 9.5% | 9.2%(+0.300)#28 | 4.9%(+4.60)#8,509 |
| 29. | Henlopen Acres | 8.7% | 9.2%(-0.500)#29 | 4.9%(+3.80)#8,903 |
| 30. | Bear | 7.7% | 9.2%(-1.50)#30 | 4.9%(+2.80)#9,347 |
| 31. | Millsboro | 7.6% | 9.2%(-1.60)#31 | 4.9%(+2.70)#9,404 |
| 32. | Greenwood | 7.6% | 9.2%(-1.60)#32 | 4.9%(+2.70)#9,419 |
| 33. | Milford | 7.5% | 9.2%(-1.70)#33 | 4.9%(+2.60)#9,458 |
| 34. | Millville | 7.5% | 9.2%(-1.70)#34 | 4.9%(+2.60)#9,477 |
| 35. | Bridgeville | 6.5% | 9.2%(-2.70)#35 | 4.9%(+1.60)#10,118 |
| 36. | Farmington | 6.4% | 9.2%(-2.80)#36 | 4.9%(+1.50)#10,225 |
| 37. | Edgemoor | 6.2% | 9.2%(-3.00)#37 | 4.9%(+1.30)#10,329 |
| 38. | Highland Acres | 6.2% | 9.2%(-3.00)#38 | 4.9%(+1.30)#10,334 |
| 39. | Hartly | 6.2% | 9.2%(-3.00)#39 | 4.9%(+1.30)#10,380 |
| 40. | Hockessin | 6.1% | 9.2%(-3.10)#40 | 4.9%(+1.20)#10,385 |
| 41. | Bethany Beach | 5.7% | 9.2%(-3.50)#41 | 4.9%(+0.800)#10,735 |
| 42. | Ellendale | 5.3% | 9.2%(-3.90)#42 | 4.9%(+0.400)#11,109 |
| 43. | Dover Base Housing | 5.0% | 9.2%(-4.20)#43 | 4.9%(+0.100)#11,352 |
| 44. | South Bethany | 4.6% | 9.2%(-4.60)#44 | 4.9%(-0.300)#11,796 |
| 45. | Clayton | 4.5% | 9.2%(-4.70)#45 | 4.9%(-0.400)#11,831 |
| 46. | Laurel | 4.5% | 9.2%(-4.70)#46 | 4.9%(-0.400)#11,832 |
| 47. | Odessa | 3.9% | 9.2%(-5.30)#47 | 4.9%(-1.00)#12,652 |
| 48. | Delmar | 3.7% | 9.2%(-5.50)#48 | 4.9%(-1.20)#12,865 |
| 49. | Pike Creek Valley | 3.6% | 9.2%(-5.60)#49 | 4.9%(-1.30)#12,966 |
| 50. | North Star | 3.6% | 9.2%(-5.60)#50 | 4.9%(-1.30)#12,973 |
| 51. | Blades | 3.6% | 9.2%(-5.60)#51 | 4.9%(-1.30)#13,038 |
| 52. | Middletown | 3.3% | 9.2%(-5.90)#52 | 4.9%(-1.60)#13,389 |
| 53. | Dover | 3.2% | 9.2%(-6.00)#53 | 4.9%(-1.70)#13,564 |
| 54. | Glasgow | 3.2% | 9.2%(-6.00)#54 | 4.9%(-1.70)#13,576 |
| 55. | Delaware City | 2.2% | 9.2%(-7.00)#55 | 4.9%(-2.70)#15,977 |
| 56. | Newark | 2.1% | 9.2%(-7.10)#56 | 4.9%(-2.80)#16,109 |
| 57. | Camden | 2.0% | 9.2%(-7.20)#57 | 4.9%(-2.90)#16,576 |
| 58. | Rodney Village | 2.0% | 9.2%(-7.20)#59 | 4.9%(-2.90)#16,649 |
| 59. | St Georges | 2.0% | 9.2%(-7.20)#60 | 4.9%(-2.90)#16,650 |
| 60. | Smyrna | 1.8% | 9.2%(-7.40)#61 | 4.9%(-3.10)#17,214 |
| 61. | Townsend | 1.8% | 9.2%(-7.40)#62 | 4.9%(-3.10)#17,338 |
| 62. | Rising Sun Lebanon | 1.7% | 9.2%(-7.50)#63 | 4.9%(-3.20)#17,701 |
| 63. | Brookside | 1.5% | 9.2%(-7.70)#64 | 4.9%(-3.40)#18,452 |
| 64. | Wyoming | 1.5% | 9.2%(-7.70)#65 | 4.9%(-3.40)#18,640 |
| 65. | New Castle | 1.4% | 9.2%(-7.80)#66 | 4.9%(-3.50)#19,008 |
| 66. | Wilmington | 1.3% | 9.2%(-7.90)#67 | 4.9%(-3.60)#19,296 |
| 67. | Bellefonte | 1.3% | 9.2%(-7.90)#68 | 4.9%(-3.60)#19,670 |
| 68. | Newport | 1.3% | 9.2%(-7.90)#69 | 4.9%(-3.60)#19,704 |
| 69. | Claymont | 1.2% | 9.2%(-8.00)#70 | 4.9%(-3.70)#19,984 |
| 70. | Seaford | 1.2% | 9.2%(-8.00)#71 | 4.9%(-3.70)#20,009 |
| 71. | Arden | 1.1% | 9.2%(-8.10)#72 | 4.9%(-3.80)#20,737 |
| 72. | Wilmington Manor | 0.70% | 9.2%(-8.50)#73 | 4.9%(-4.20)#22,548 |
| 73. | Greenville | 0.60% | 9.2%(-8.60)#74 | 4.9%(-4.30)#23,171 |
| 74. | Elsmere | 0.10% | 9.2%(-9.10)#75 | 4.9%(-4.80)#24,801 |
| 75. | Harrington | 0.10% | 9.2%(-9.10)#76 | 4.9%(-4.80)#24,811 |
1
Common Questions
What are the Top 10 Cities with the Highest Percentage of Households Heated by Bottled Gas / Liquid Propane in Delaware?
Top 10 Cities with the Highest Percentage of Households Heated by Bottled Gas / Liquid Propane in Delaware are:
#1
55.6%
#2
38.2%
#3
32.9%
#4
32.3%
#5
30.1%
#6
29.5%
#7
26.3%
#8
25.4%
#9
25.3%
#10
24.4%
What city has the Highest Percentage of Households Heated by Bottled Gas / Liquid Propane in Delaware?
Long Neck has the Highest Percentage of Households Heated by Bottled Gas / Liquid Propane in Delaware with 55.6%.
What is the Percentage of Households Heated by Bottled Gas / Liquid Propane in the State of Delaware?
Percentage of Households Heated by Bottled Gas / Liquid Propane in Delaware is 9.2%.
What is the Percentage of Households Heated by Bottled Gas / Liquid Propane in the United States?
Percentage of Households Heated by Bottled Gas / Liquid Propane in the United States is 4.9%.