Zip Codes with the Highest Percentage of Households Heated by Bottled Gas / Liquid Propane in Bellingham, WA
RELATED REPORTS & OPTIONS
Bottled Gas / LP Heating
Bellingham
Compare Zip Codes
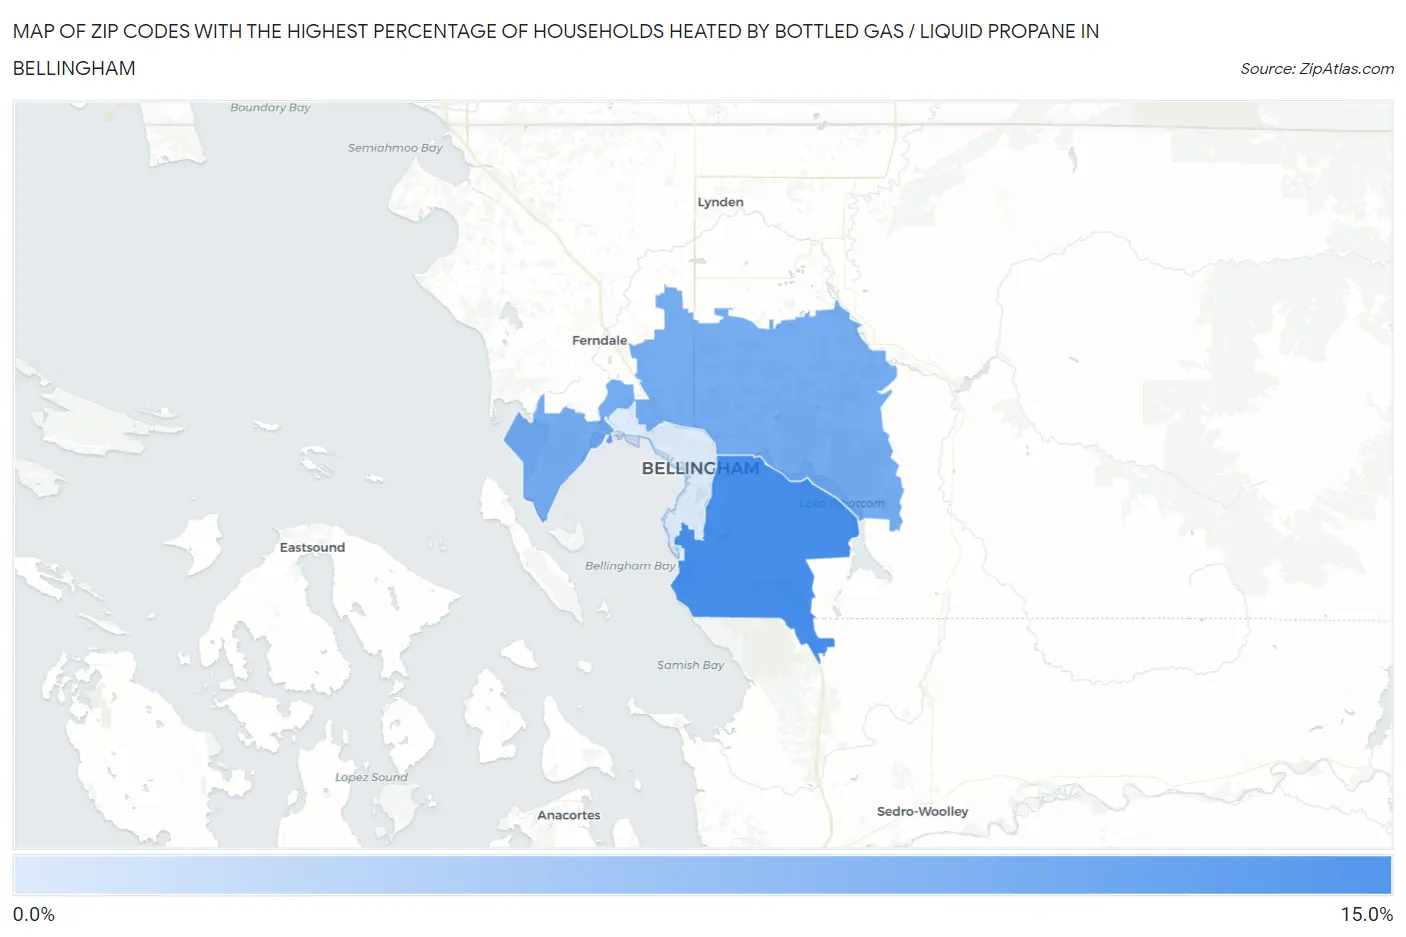
Map of Zip Codes with the Highest Percentage of Households Heated by Bottled Gas / Liquid Propane in Bellingham
1.2%
12.1%
Zip Codes with the Highest Percentage of Households Heated by Bottled Gas / Liquid Propane in Bellingham, WA
| Zip Code | Bottled Gas / LP Heating | vs State | vs National | |
| 1. | 98229 | 12.1% | 3.1%(+9.00)#80 | 4.9%(+7.20)#12,988 |
| 2. | 98226 | 8.6% | 3.1%(+5.50)#125 | 4.9%(+3.70)#15,444 |
| 3. | 98225 | 1.2% | 3.1%(-1.90)#371 | 4.9%(-3.70)#25,759 |
1
Common Questions
What are the Top Zip Codes with the Highest Percentage of Households Heated by Bottled Gas / Liquid Propane in Bellingham, WA?
Top Zip Codes with the Highest Percentage of Households Heated by Bottled Gas / Liquid Propane in Bellingham, WA are:
What zip code has the Highest Percentage of Households Heated by Bottled Gas / Liquid Propane in Bellingham, WA?
98229 has the Highest Percentage of Households Heated by Bottled Gas / Liquid Propane in Bellingham, WA with 12.1%.
What is the Percentage of Households Heated by Bottled Gas / Liquid Propane in Bellingham, WA?
Percentage of Households Heated by Bottled Gas / Liquid Propane in Bellingham is 1.1%.
What is the Percentage of Households Heated by Bottled Gas / Liquid Propane in Washington?
Percentage of Households Heated by Bottled Gas / Liquid Propane in Washington is 3.1%.
What is the Percentage of Households Heated by Bottled Gas / Liquid Propane in the United States?
Percentage of Households Heated by Bottled Gas / Liquid Propane in the United States is 4.9%.