Cities with the Highest Percentage of Households Heated by Bottled Gas / Liquid Propane in Virginia
RELATED REPORTS & OPTIONS
Bottled Gas / LP Heating
Virginia
Compare Cities
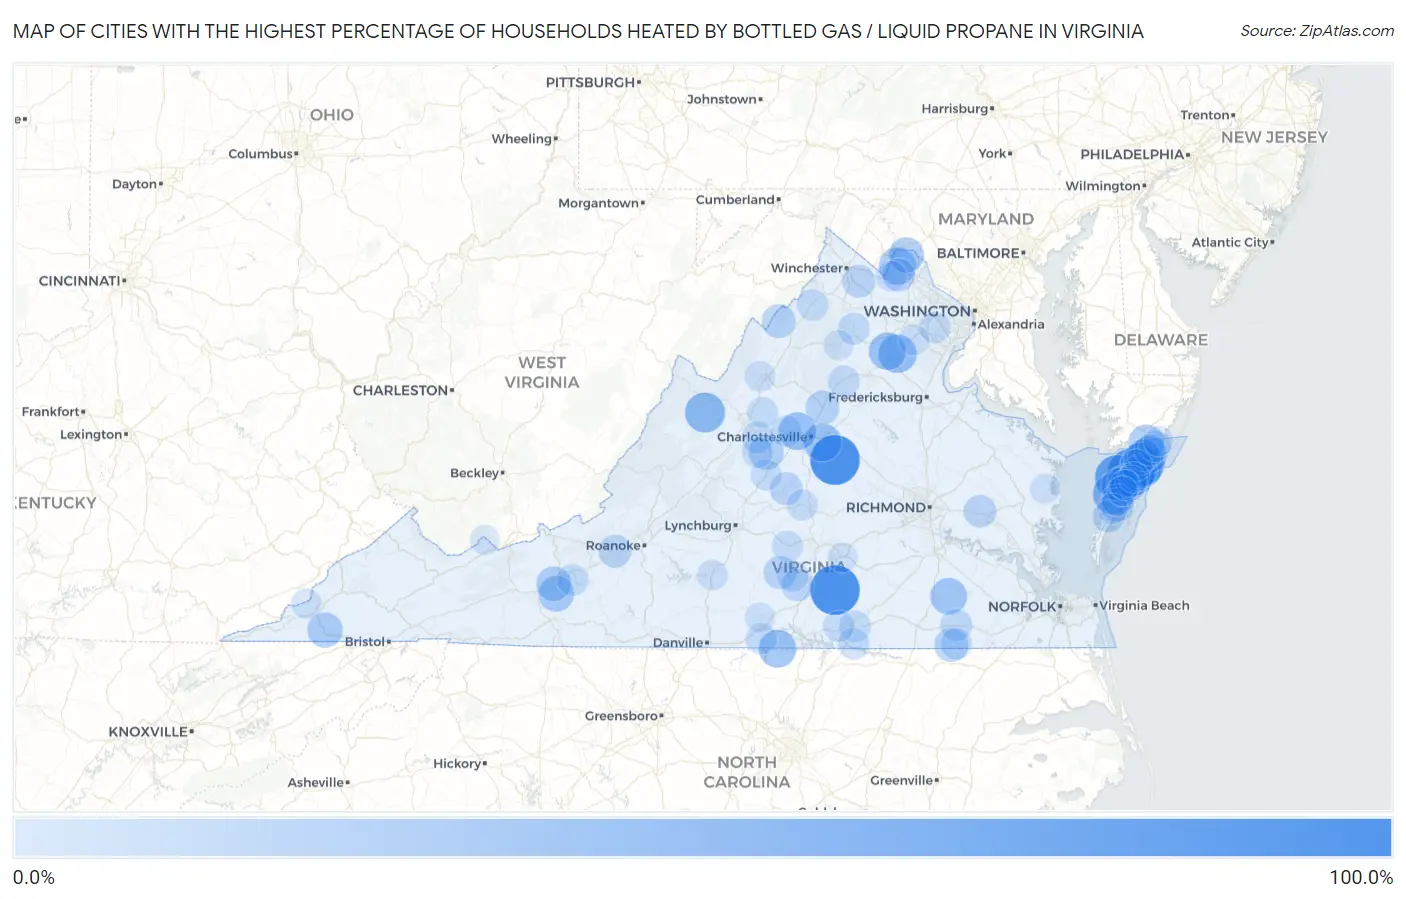
Map of Cities with the Highest Percentage of Households Heated by Bottled Gas / Liquid Propane in Virginia
0.0%
100.0%
Cities with the Highest Percentage of Households Heated by Bottled Gas / Liquid Propane in Virginia
| City | Bottled Gas / LP Heating | vs State | vs National | |
| 1. | Lunenburg | 100.0% | 4.2%(+95.8)#1 | 4.9%(+95.1)#10 |
| 2. | Palmyra | 100.0% | 4.2%(+95.8)#2 | 4.9%(+95.1)#21 |
| 3. | Keswick | 95.7% | 4.2%(+91.5)#3 | 4.9%(+90.8)#313 |
| 4. | Whitesville | 90.7% | 4.2%(+86.5)#4 | 4.9%(+85.8)#384 |
| 5. | Southside Chesconessex | 80.4% | 4.2%(+76.2)#5 | 4.9%(+75.5)#662 |
| 6. | Mappsville | 75.3% | 4.2%(+71.1)#6 | 4.9%(+70.4)#853 |
| 7. | Eagle Rock | 71.8% | 4.2%(+67.6)#7 | 4.9%(+66.9)#1,039 |
| 8. | Willis Wharf | 66.2% | 4.2%(+62.0)#8 | 4.9%(+61.3)#1,333 |
| 9. | Barboursville | 66.1% | 4.2%(+61.9)#9 | 4.9%(+61.2)#1,335 |
| 10. | Pungoteague | 65.1% | 4.2%(+60.9)#10 | 4.9%(+60.2)#1,395 |
| 11. | Deerfield | 58.2% | 4.2%(+54.0)#11 | 4.9%(+53.3)#1,832 |
| 12. | Modest Town | 56.7% | 4.2%(+52.5)#12 | 4.9%(+51.8)#1,949 |
| 13. | Breaks | 54.2% | 4.2%(+50.0)#13 | 4.9%(+49.3)#2,120 |
| 14. | Dunbar | 53.5% | 4.2%(+49.3)#14 | 4.9%(+48.6)#2,166 |
| 15. | Midland | 51.4% | 4.2%(+47.2)#15 | 4.9%(+46.5)#2,304 |
| 16. | Mendota | 50.0% | 4.2%(+45.8)#16 | 4.9%(+45.1)#2,387 |
| 17. | Tasley | 50.0% | 4.2%(+45.8)#17 | 4.9%(+45.1)#2,396 |
| 18. | Rivanna | 49.4% | 4.2%(+45.2)#18 | 4.9%(+44.5)#2,456 |
| 19. | Ivy | 49.0% | 4.2%(+44.8)#19 | 4.9%(+44.1)#2,482 |
| 20. | Virgilina | 48.3% | 4.2%(+44.1)#20 | 4.9%(+43.4)#2,528 |
| 21. | Savageville | 48.1% | 4.2%(+43.9)#21 | 4.9%(+43.2)#2,538 |
| 22. | Opal | 47.5% | 4.2%(+43.3)#22 | 4.9%(+42.6)#2,597 |
| 23. | Hillsboro | 46.3% | 4.2%(+42.1)#23 | 4.9%(+41.4)#2,710 |
| 24. | Sussex | 44.6% | 4.2%(+40.4)#24 | 4.9%(+39.7)#2,842 |
| 25. | Atlantic | 42.9% | 4.2%(+38.7)#25 | 4.9%(+38.0)#2,984 |
| 26. | New Church | 40.6% | 4.2%(+36.4)#26 | 4.9%(+35.7)#3,183 |
| 27. | Allisonia | 40.0% | 4.2%(+35.8)#27 | 4.9%(+35.1)#3,236 |
| 28. | Lovettsville | 38.7% | 4.2%(+34.5)#28 | 4.9%(+33.8)#3,345 |
| 29. | Schooner Bay | 38.5% | 4.2%(+34.3)#29 | 4.9%(+33.6)#3,372 |
| 30. | Clinchport | 38.1% | 4.2%(+33.9)#30 | 4.9%(+33.2)#3,408 |
| 31. | Draper | 36.7% | 4.2%(+32.5)#31 | 4.9%(+31.8)#3,533 |
| 32. | Nellysford | 35.5% | 4.2%(+31.3)#32 | 4.9%(+30.6)#3,631 |
| 33. | Locust Mount | 35.4% | 4.2%(+31.2)#33 | 4.9%(+30.5)#3,643 |
| 34. | Metompkin | 33.5% | 4.2%(+29.3)#34 | 4.9%(+28.6)#3,819 |
| 35. | Gargatha | 33.1% | 4.2%(+28.9)#35 | 4.9%(+28.2)#3,883 |
| 36. | Branchville | 32.6% | 4.2%(+28.4)#36 | 4.9%(+27.7)#3,938 |
| 37. | Basye | 32.4% | 4.2%(+28.2)#37 | 4.9%(+27.5)#3,952 |
| 38. | Ruckersville | 32.2% | 4.2%(+28.0)#38 | 4.9%(+27.3)#3,976 |
| 39. | Cats Bridge | 30.4% | 4.2%(+26.2)#39 | 4.9%(+25.5)#4,184 |
| 40. | Phenix | 29.8% | 4.2%(+25.6)#40 | 4.9%(+24.9)#4,248 |
| 41. | Brandy Station | 29.4% | 4.2%(+25.2)#41 | 4.9%(+24.5)#4,303 |
| 42. | Purcellville | 28.5% | 4.2%(+24.3)#42 | 4.9%(+23.6)#4,421 |
| 43. | Boyce | 28.5% | 4.2%(+24.3)#43 | 4.9%(+23.6)#4,424 |
| 44. | Lafayette | 28.5% | 4.2%(+24.3)#44 | 4.9%(+23.6)#4,428 |
| 45. | Yogaville | 28.4% | 4.2%(+24.2)#45 | 4.9%(+23.5)#4,444 |
| 46. | Paris | 27.6% | 4.2%(+23.4)#46 | 4.9%(+22.7)#4,528 |
| 47. | New Kent | 27.5% | 4.2%(+23.3)#47 | 4.9%(+22.6)#4,534 |
| 48. | Abbs Valley | 26.7% | 4.2%(+22.5)#48 | 4.9%(+21.8)#4,655 |
| 49. | Drakes Branch | 26.5% | 4.2%(+22.3)#49 | 4.9%(+21.6)#4,679 |
| 50. | Nassawadox | 26.2% | 4.2%(+22.0)#50 | 4.9%(+21.3)#4,720 |
| 51. | Hallwood | 26.0% | 4.2%(+21.8)#51 | 4.9%(+21.1)#4,758 |
| 52. | Temperanceville | 25.8% | 4.2%(+21.6)#52 | 4.9%(+20.9)#4,782 |
| 53. | Capron | 24.6% | 4.2%(+20.4)#53 | 4.9%(+19.7)#4,979 |
| 54. | Brightwood | 24.4% | 4.2%(+20.2)#54 | 4.9%(+19.5)#4,993 |
| 55. | Lyndhurst | 24.2% | 4.2%(+20.0)#55 | 4.9%(+19.3)#5,022 |
| 56. | North Garden | 24.2% | 4.2%(+20.0)#56 | 4.9%(+19.3)#5,027 |
| 57. | Painter | 24.2% | 4.2%(+20.0)#57 | 4.9%(+19.3)#5,029 |
| 58. | Horntown | 23.9% | 4.2%(+19.7)#58 | 4.9%(+19.0)#5,064 |
| 59. | Flint Hill | 23.9% | 4.2%(+19.7)#59 | 4.9%(+19.0)#5,066 |
| 60. | Ripplemead | 23.4% | 4.2%(+19.2)#60 | 4.9%(+18.5)#5,135 |
| 61. | La Crosse | 23.3% | 4.2%(+19.1)#61 | 4.9%(+18.4)#5,145 |
| 62. | Osaka | 23.3% | 4.2%(+19.1)#62 | 4.9%(+18.4)#5,156 |
| 63. | Bracey | 22.9% | 4.2%(+18.7)#63 | 4.9%(+18.0)#5,207 |
| 64. | Snowville | 22.9% | 4.2%(+18.7)#64 | 4.9%(+18.0)#5,224 |
| 65. | Boykins | 22.8% | 4.2%(+18.6)#65 | 4.9%(+17.9)#5,227 |
| 66. | Crozet | 22.6% | 4.2%(+18.4)#66 | 4.9%(+17.7)#5,246 |
| 67. | Clifton | 22.5% | 4.2%(+18.3)#67 | 4.9%(+17.6)#5,277 |
| 68. | Accomac | 22.4% | 4.2%(+18.2)#68 | 4.9%(+17.5)#5,286 |
| 69. | Wattsville | 22.3% | 4.2%(+18.1)#69 | 4.9%(+17.4)#5,302 |
| 70. | Maurertown | 22.2% | 4.2%(+18.0)#70 | 4.9%(+17.3)#5,309 |
| 71. | Cluster Springs | 21.8% | 4.2%(+17.6)#71 | 4.9%(+16.9)#5,380 |
| 72. | Union Level | 21.8% | 4.2%(+17.6)#72 | 4.9%(+16.9)#5,390 |
| 73. | Charlotte Court House | 21.7% | 4.2%(+17.5)#73 | 4.9%(+16.8)#5,398 |
| 74. | Afton | 21.7% | 4.2%(+17.5)#74 | 4.9%(+16.8)#5,404 |
| 75. | Bloxom | 21.6% | 4.2%(+17.4)#75 | 4.9%(+16.7)#5,426 |
| 76. | New Hope | 21.4% | 4.2%(+17.2)#76 | 4.9%(+16.5)#5,442 |
| 77. | Buckingham Courthouse | 21.4% | 4.2%(+17.2)#77 | 4.9%(+16.5)#5,449 |
| 78. | Pamplin City | 21.4% | 4.2%(+17.2)#78 | 4.9%(+16.5)#5,455 |
| 79. | Lovingston | 21.1% | 4.2%(+16.9)#79 | 4.9%(+16.2)#5,496 |
| 80. | Onancock | 20.8% | 4.2%(+16.6)#80 | 4.9%(+15.9)#5,534 |
| 81. | Belmont Estates | 20.2% | 4.2%(+16.0)#81 | 4.9%(+15.3)#5,640 |
| 82. | Wintergreen | 20.2% | 4.2%(+16.0)#82 | 4.9%(+15.3)#5,649 |
| 83. | Weems | 19.3% | 4.2%(+15.1)#83 | 4.9%(+14.4)#5,815 |
| 84. | Mount Clifton | 19.3% | 4.2%(+15.1)#84 | 4.9%(+14.4)#5,816 |
| 85. | Motley | 19.2% | 4.2%(+15.0)#85 | 4.9%(+14.3)#5,823 |
| 86. | Exmore | 19.1% | 4.2%(+14.9)#86 | 4.9%(+14.2)#5,834 |
| 87. | Round Hill | 19.0% | 4.2%(+14.8)#87 | 4.9%(+14.1)#5,851 |
| 88. | Big Rock | 19.0% | 4.2%(+14.8)#88 | 4.9%(+14.1)#5,863 |
| 89. | Nokesville | 18.8% | 4.2%(+14.6)#89 | 4.9%(+13.9)#5,891 |
| 90. | Falls Mills | 18.6% | 4.2%(+14.4)#90 | 4.9%(+13.7)#5,947 |
| 91. | Pastoria | 18.3% | 4.2%(+14.1)#91 | 4.9%(+13.4)#5,997 |
| 92. | Keokee | 18.1% | 4.2%(+13.9)#92 | 4.9%(+13.2)#6,058 |
| 93. | Irvington | 17.7% | 4.2%(+13.5)#93 | 4.9%(+12.8)#6,145 |
| 94. | Captains Cove | 17.4% | 4.2%(+13.2)#94 | 4.9%(+12.5)#6,222 |
| 95. | Halifax | 17.3% | 4.2%(+13.1)#95 | 4.9%(+12.4)#6,248 |
| 96. | Onley | 17.3% | 4.2%(+13.1)#96 | 4.9%(+12.4)#6,251 |
| 97. | Burkeville | 17.3% | 4.2%(+13.1)#97 | 4.9%(+12.4)#6,254 |
| 98. | Pocahontas | 17.2% | 4.2%(+13.0)#98 | 4.9%(+12.3)#6,277 |
| 99. | Melfa | 17.1% | 4.2%(+12.9)#99 | 4.9%(+12.2)#6,292 |
| 100. | Sperryville | 17.1% | 4.2%(+12.9)#100 | 4.9%(+12.2)#6,294 |
Common Questions
What are the Top 10 Cities with the Highest Percentage of Households Heated by Bottled Gas / Liquid Propane in Virginia?
Top 10 Cities with the Highest Percentage of Households Heated by Bottled Gas / Liquid Propane in Virginia are:
#1
100.0%
#2
100.0%
#3
90.7%
#4
80.4%
#5
75.3%
#6
65.1%
#7
58.2%
#8
56.7%
#9
51.4%
#10
50.0%
What city has the Highest Percentage of Households Heated by Bottled Gas / Liquid Propane in Virginia?
Lunenburg has the Highest Percentage of Households Heated by Bottled Gas / Liquid Propane in Virginia with 100.0%.
What is the Percentage of Households Heated by Bottled Gas / Liquid Propane in the State of Virginia?
Percentage of Households Heated by Bottled Gas / Liquid Propane in Virginia is 4.2%.
What is the Percentage of Households Heated by Bottled Gas / Liquid Propane in the United States?
Percentage of Households Heated by Bottled Gas / Liquid Propane in the United States is 4.9%.