Cities with the Highest Percentage of Households Heated by Bottled Gas / Liquid Propane in Connecticut
RELATED REPORTS & OPTIONS
Bottled Gas / LP Heating
Connecticut
Compare Cities
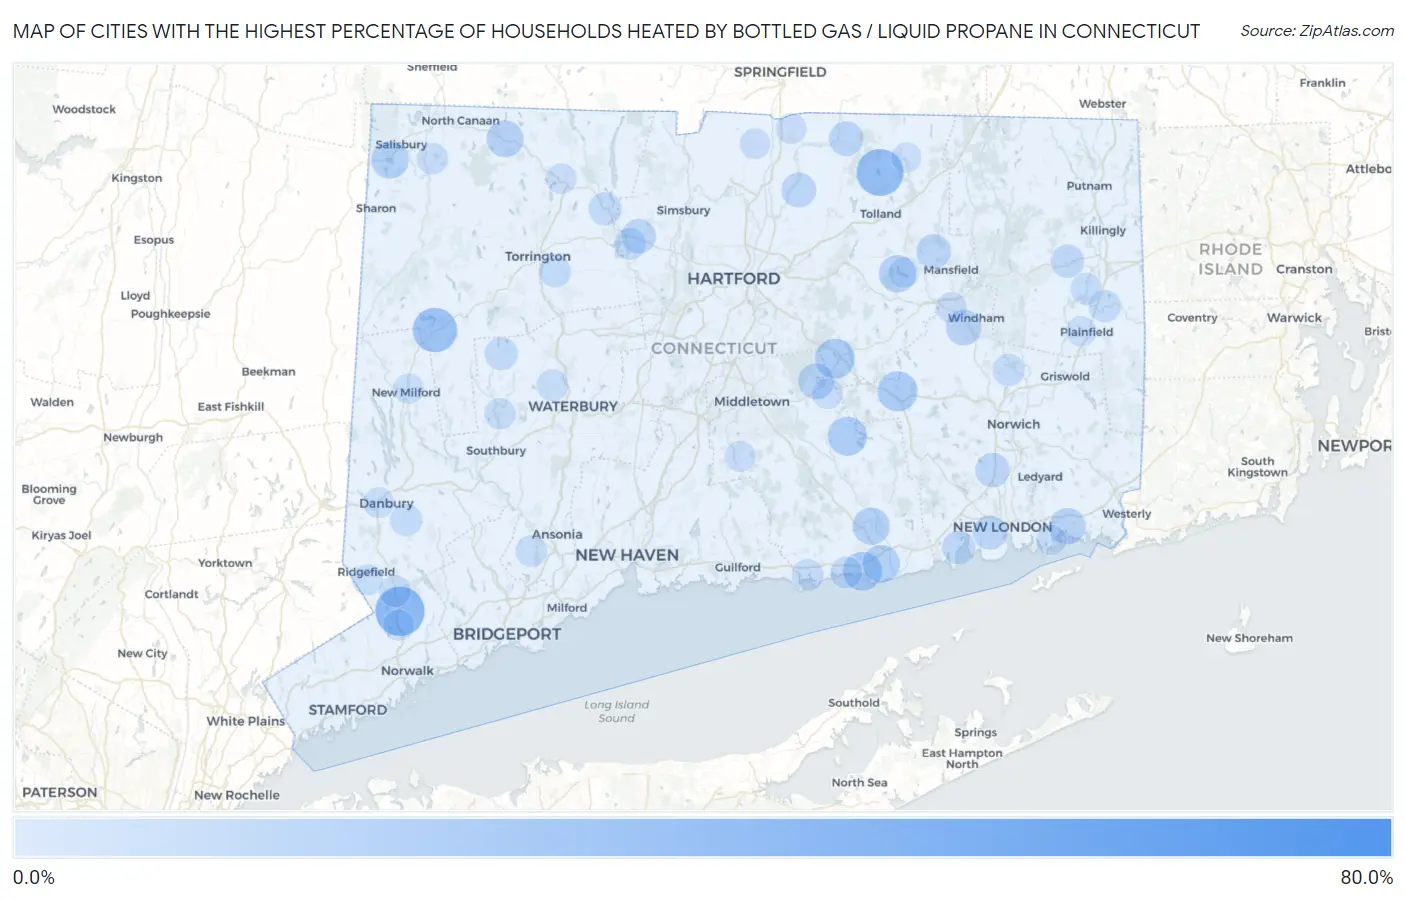
Map of Cities with the Highest Percentage of Households Heated by Bottled Gas / Liquid Propane in Connecticut
0.0%
80.0%
Cities with the Highest Percentage of Households Heated by Bottled Gas / Liquid Propane in Connecticut
| City | Bottled Gas / LP Heating | vs State | vs National | |
| 1. | Candlewood Lake Club | 74.3% | 5.2%(+69.1)#1 | 4.9%(+69.4)#921 |
| 2. | Chimney Point | 70.5% | 5.2%(+65.3)#2 | 4.9%(+65.6)#1,103 |
| 3. | Fenwick Borough | 54.2% | 5.2%(+49.0)#3 | 4.9%(+49.3)#2,127 |
| 4. | Sail Harbor | 47.9% | 5.2%(+42.7)#4 | 4.9%(+43.0)#2,563 |
| 5. | Cannondale | 38.2% | 5.2%(+33.0)#5 | 4.9%(+33.3)#3,391 |
| 6. | Crystal Lake | 33.8% | 5.2%(+28.6)#6 | 4.9%(+28.9)#3,796 |
| 7. | Cornwall Bridge | 31.8% | 5.2%(+26.6)#7 | 4.9%(+26.9)#4,022 |
| 8. | New Preston | 29.3% | 5.2%(+24.1)#8 | 4.9%(+24.4)#4,312 |
| 9. | Lake Bungee | 29.1% | 5.2%(+23.9)#9 | 4.9%(+24.2)#4,339 |
| 10. | Candlewood Knolls | 27.0% | 5.2%(+21.8)#10 | 4.9%(+22.1)#4,613 |
| 11. | West Cornwall | 26.9% | 5.2%(+21.7)#11 | 4.9%(+22.0)#4,629 |
| 12. | Taylor Corners | 25.4% | 5.2%(+20.2)#12 | 4.9%(+20.5)#4,841 |
| 13. | Colchester | 21.8% | 5.2%(+16.6)#13 | 4.9%(+16.9)#5,373 |
| 14. | Terramuggus | 21.6% | 5.2%(+16.4)#14 | 4.9%(+16.7)#5,418 |
| 15. | Weston | 20.5% | 5.2%(+15.3)#15 | 4.9%(+15.6)#5,594 |
| 16. | Tokeneke | 20.2% | 5.2%(+15.0)#16 | 4.9%(+15.3)#5,639 |
| 17. | Moodus | 20.1% | 5.2%(+14.9)#17 | 4.9%(+15.2)#5,659 |
| 18. | Saybrook Manor | 20.1% | 5.2%(+14.9)#18 | 4.9%(+15.2)#5,661 |
| 19. | Ball Pond | 19.8% | 5.2%(+14.6)#19 | 4.9%(+14.9)#5,734 |
| 20. | Groton Long Point Borough | 19.5% | 5.2%(+14.3)#20 | 4.9%(+14.6)#5,783 |
| 21. | Quasset Lake | 19.0% | 5.2%(+13.8)#21 | 4.9%(+14.1)#5,858 |
| 22. | Lake Chaffee | 18.1% | 5.2%(+12.9)#22 | 4.9%(+13.2)#6,059 |
| 23. | Old Saybrook Center | 17.8% | 5.2%(+12.6)#23 | 4.9%(+12.9)#6,115 |
| 24. | Branchville | 17.7% | 5.2%(+12.5)#24 | 4.9%(+12.8)#6,153 |
| 25. | Stonington Borough | 17.6% | 5.2%(+12.4)#25 | 4.9%(+12.7)#6,164 |
| 26. | Lakeville | 17.4% | 5.2%(+12.2)#26 | 4.9%(+12.5)#6,223 |
| 27. | Coventry Lake | 17.1% | 5.2%(+11.9)#27 | 4.9%(+12.2)#6,288 |
| 28. | Compo | 17.0% | 5.2%(+11.8)#28 | 4.9%(+12.1)#6,306 |
| 29. | Essex Village | 16.9% | 5.2%(+11.7)#29 | 4.9%(+12.0)#6,326 |
| 30. | Norfolk | 16.2% | 5.2%(+11.0)#30 | 4.9%(+11.3)#6,489 |
| 31. | Mystic | 15.9% | 5.2%(+10.7)#31 | 4.9%(+11.0)#6,546 |
| 32. | Lake Pocotopaug | 15.1% | 5.2%(+9.90)#32 | 4.9%(+10.2)#6,749 |
| 33. | South Windham | 14.5% | 5.2%(+9.30)#33 | 4.9%(+9.60)#6,885 |
| 34. | Rock Ridge | 13.9% | 5.2%(+8.70)#34 | 4.9%(+9.00)#7,039 |
| 35. | Candlewood Shores | 13.4% | 5.2%(+8.20)#35 | 4.9%(+8.50)#7,170 |
| 36. | Noroton | 13.3% | 5.2%(+8.10)#36 | 4.9%(+8.40)#7,181 |
| 37. | Inglenook | 13.2% | 5.2%(+8.00)#37 | 4.9%(+8.30)#7,215 |
| 38. | Broad Brook | 12.9% | 5.2%(+7.70)#38 | 4.9%(+8.00)#7,290 |
| 39. | Storrs | 12.8% | 5.2%(+7.60)#39 | 4.9%(+7.90)#7,319 |
| 40. | Somers | 12.8% | 5.2%(+7.60)#40 | 4.9%(+7.90)#7,325 |
| 41. | Canton Valley | 12.4% | 5.2%(+7.20)#41 | 4.9%(+7.50)#7,463 |
| 42. | Oxoboxo River | 12.3% | 5.2%(+7.10)#42 | 4.9%(+7.40)#7,489 |
| 43. | Bogus Hill | 12.2% | 5.2%(+7.00)#43 | 4.9%(+7.30)#7,550 |
| 44. | Waterford | 12.1% | 5.2%(+6.90)#44 | 4.9%(+7.20)#7,556 |
| 45. | Lakeside Woods | 12.0% | 5.2%(+6.80)#45 | 4.9%(+7.10)#7,609 |
| 46. | Sandy Hook | 11.9% | 5.2%(+6.70)#46 | 4.9%(+7.00)#7,626 |
| 47. | Lakes East | 11.8% | 5.2%(+6.60)#47 | 4.9%(+6.90)#7,666 |
| 48. | Saugatuck | 11.7% | 5.2%(+6.50)#48 | 4.9%(+6.80)#7,699 |
| 49. | Bridgewater | 10.9% | 5.2%(+5.70)#49 | 4.9%(+6.00)#7,988 |
| 50. | Cornwall | 10.8% | 5.2%(+5.60)#50 | 4.9%(+5.90)#8,015 |
| 51. | Brooklyn | 10.6% | 5.2%(+5.40)#51 | 4.9%(+5.70)#8,074 |
| 52. | Niantic | 10.5% | 5.2%(+5.30)#52 | 4.9%(+5.60)#8,095 |
| 53. | Bantam Borough | 10.2% | 5.2%(+5.00)#53 | 4.9%(+5.30)#8,218 |
| 54. | Coleytown | 10.1% | 5.2%(+4.90)#54 | 4.9%(+5.20)#8,236 |
| 55. | Bethlehem Village | 10.1% | 5.2%(+4.90)#55 | 4.9%(+5.20)#8,241 |
| 56. | New Hartford Center | 10.1% | 5.2%(+4.90)#56 | 4.9%(+5.20)#8,247 |
| 57. | Bethel | 8.6% | 5.2%(+3.40)#57 | 4.9%(+3.70)#8,909 |
| 58. | Moosup | 8.6% | 5.2%(+3.40)#58 | 4.9%(+3.70)#8,914 |
| 59. | Baltic | 8.6% | 5.2%(+3.40)#59 | 4.9%(+3.70)#8,931 |
| 60. | Northwest Harwinton | 8.4% | 5.2%(+3.20)#60 | 4.9%(+3.50)#9,000 |
| 61. | Noroton Heights | 8.3% | 5.2%(+3.10)#61 | 4.9%(+3.40)#9,041 |
| 62. | Northford | 8.2% | 5.2%(+3.00)#62 | 4.9%(+3.30)#9,097 |
| 63. | Westbrook Center | 8.2% | 5.2%(+3.00)#63 | 4.9%(+3.30)#9,107 |
| 64. | Route 7 Gateway | 8.1% | 5.2%(+2.90)#64 | 4.9%(+3.20)#9,151 |
| 65. | Collinsville | 8.0% | 5.2%(+2.80)#65 | 4.9%(+3.10)#9,188 |
| 66. | Clinton | 8.0% | 5.2%(+2.80)#66 | 4.9%(+3.10)#9,190 |
| 67. | Litchfield Borough | 8.0% | 5.2%(+2.80)#67 | 4.9%(+3.10)#9,202 |
| 68. | Old Hill | 7.8% | 5.2%(+2.60)#68 | 4.9%(+2.90)#9,301 |
| 69. | Candlewood Orchards | 7.8% | 5.2%(+2.60)#69 | 4.9%(+2.90)#9,330 |
| 70. | Oakville | 7.7% | 5.2%(+2.50)#70 | 4.9%(+2.80)#9,350 |
| 71. | Ridgebury | 7.6% | 5.2%(+2.40)#71 | 4.9%(+2.70)#9,414 |
| 72. | Georgetown | 7.6% | 5.2%(+2.40)#72 | 4.9%(+2.70)#9,418 |
| 73. | Wauregan | 7.5% | 5.2%(+2.30)#73 | 4.9%(+2.60)#9,488 |
| 74. | Shelton | 7.4% | 5.2%(+2.20)#74 | 4.9%(+2.50)#9,538 |
| 75. | Falls Village | 7.4% | 5.2%(+2.20)#75 | 4.9%(+2.50)#9,572 |
| 76. | Riverton | 7.4% | 5.2%(+2.20)#76 | 4.9%(+2.50)#9,575 |
| 77. | Woodbury Center | 6.9% | 5.2%(+1.70)#77 | 4.9%(+2.00)#9,872 |
| 78. | Knollcrest | 6.9% | 5.2%(+1.70)#78 | 4.9%(+2.00)#9,903 |
| 79. | New Canaan | 6.7% | 5.2%(+1.50)#79 | 4.9%(+1.80)#9,986 |
| 80. | Wilton Center | 6.7% | 5.2%(+1.50)#80 | 4.9%(+1.80)#10,001 |
| 81. | Naugatuck Borough | 6.5% | 5.2%(+1.30)#81 | 4.9%(+1.60)#10,099 |
| 82. | Durham | 6.5% | 5.2%(+1.30)#82 | 4.9%(+1.60)#10,112 |
| 83. | Staples | 6.4% | 5.2%(+1.20)#83 | 4.9%(+1.50)#10,173 |
| 84. | Jewett City Borough | 6.3% | 5.2%(+1.10)#84 | 4.9%(+1.40)#10,243 |
| 85. | Ridgefield | 6.2% | 5.2%(+1.000)#85 | 4.9%(+1.30)#10,325 |
| 86. | Sherwood Manor | 6.1% | 5.2%(+0.900)#86 | 4.9%(+1.20)#10,389 |
| 87. | East Hampton | 6.1% | 5.2%(+0.900)#87 | 4.9%(+1.20)#10,402 |
| 88. | Suffield Depot | 6.1% | 5.2%(+0.900)#88 | 4.9%(+1.20)#10,410 |
| 89. | Candlewood Isle | 6.1% | 5.2%(+0.900)#89 | 4.9%(+1.20)#10,438 |
| 90. | Winsted | 6.0% | 5.2%(+0.800)#90 | 4.9%(+1.10)#10,453 |
| 91. | Westport | 6.0% | 5.2%(+0.800)#91 | 4.9%(+1.10)#10,468 |
| 92. | Danbury | 5.9% | 5.2%(+0.700)#92 | 4.9%(+1.00)#10,529 |
| 93. | Willimantic | 5.8% | 5.2%(+0.600)#93 | 4.9%(+0.900)#10,613 |
| 94. | New Milford | 5.7% | 5.2%(+0.500)#94 | 4.9%(+0.800)#10,693 |
| 95. | Botsford | 5.7% | 5.2%(+0.500)#95 | 4.9%(+0.800)#10,757 |
| 96. | Plainfield Village | 5.6% | 5.2%(+0.400)#96 | 4.9%(+0.700)#10,816 |
| 97. | South Coventry | 5.6% | 5.2%(+0.400)#97 | 4.9%(+0.700)#10,831 |
| 98. | Mamanasco Lake | 5.5% | 5.2%(+0.300)#98 | 4.9%(+0.600)#10,960 |
| 99. | Stafford Springs | 5.4% | 5.2%(+0.200)#99 | 4.9%(+0.500)#10,983 |
| 100. | Noank | 5.1% | 5.2%(-0.100)#100 | 4.9%(+0.200)#11,276 |
Common Questions
What are the Top 10 Cities with the Highest Percentage of Households Heated by Bottled Gas / Liquid Propane in Connecticut?
Top 10 Cities with the Highest Percentage of Households Heated by Bottled Gas / Liquid Propane in Connecticut are:
#1
38.2%
#2
33.8%
#3
29.3%
#4
21.8%
#5
21.6%
#6
20.1%
#7
20.1%
#8
17.8%
#9
17.4%
#10
17.1%
What city has the Highest Percentage of Households Heated by Bottled Gas / Liquid Propane in Connecticut?
Cannondale has the Highest Percentage of Households Heated by Bottled Gas / Liquid Propane in Connecticut with 38.2%.
What is the Percentage of Households Heated by Bottled Gas / Liquid Propane in the State of Connecticut?
Percentage of Households Heated by Bottled Gas / Liquid Propane in Connecticut is 5.2%.
What is the Percentage of Households Heated by Bottled Gas / Liquid Propane in the United States?
Percentage of Households Heated by Bottled Gas / Liquid Propane in the United States is 4.9%.