Cities with the Highest Percentage of Households Heated by Bottled Gas / Liquid Propane in New York
RELATED REPORTS & OPTIONS
Bottled Gas / LP Heating
New York
Compare Cities
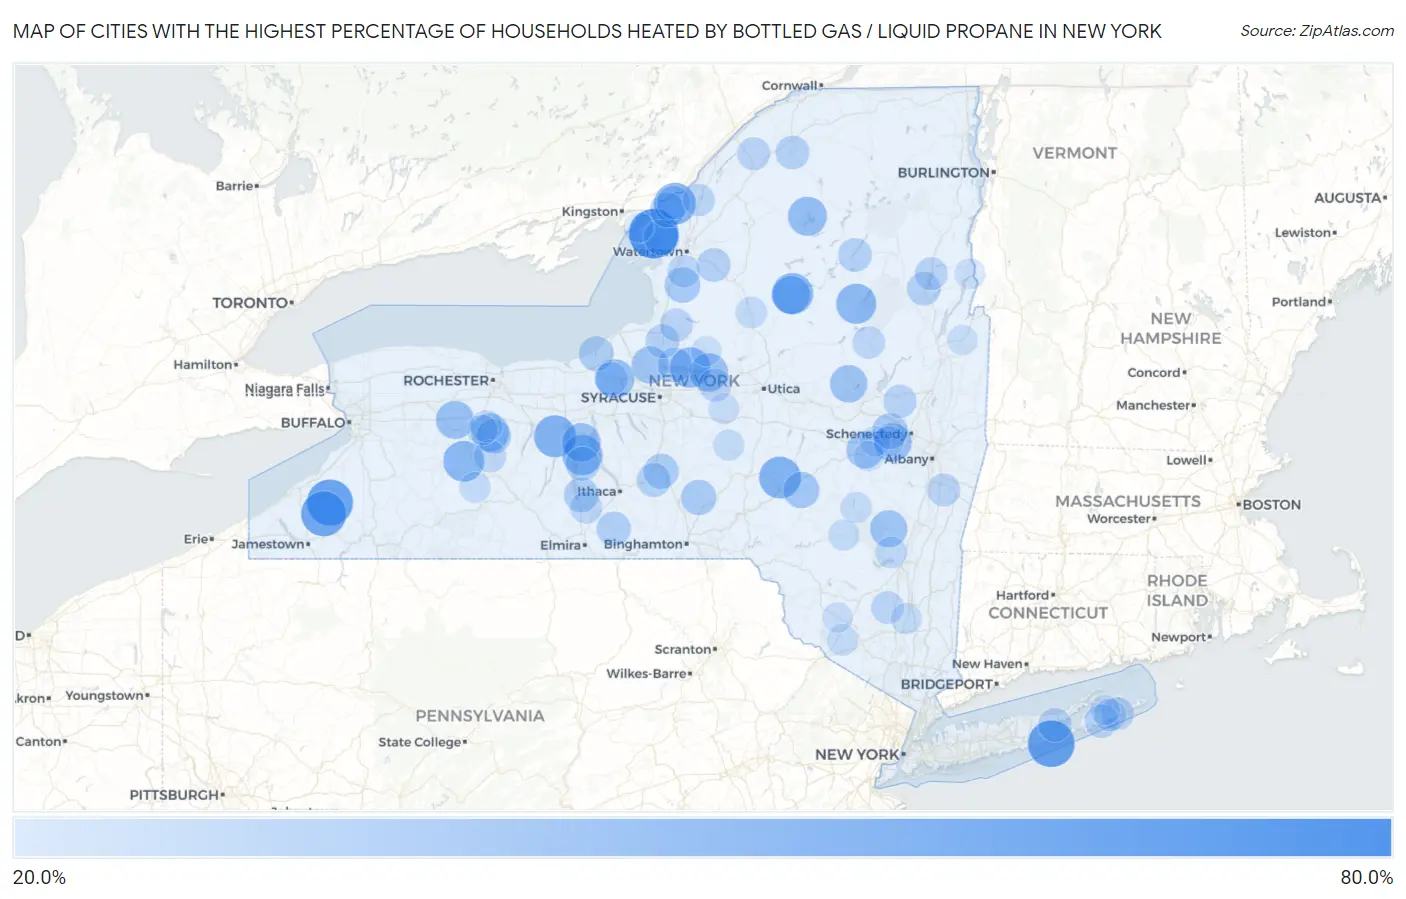
Map of Cities with the Highest Percentage of Households Heated by Bottled Gas / Liquid Propane in New York
0.0%
80.0%
Cities with the Highest Percentage of Households Heated by Bottled Gas / Liquid Propane in New York
| City | Bottled Gas / LP Heating | vs State | vs National | |
| 1. | Captree | 77.4% | 4.6%(+72.8)#1 | 4.9%(+72.5)#769 |
| 2. | Three Mile Bay | 74.2% | 4.6%(+69.6)#2 | 4.9%(+69.3)#926 |
| 3. | West Hampton Dunes | 66.7% | 4.6%(+62.1)#3 | 4.9%(+61.8)#1,287 |
| 4. | South Dayton | 64.6% | 4.6%(+60.0)#4 | 4.9%(+59.7)#1,420 |
| 5. | Cherry Creek | 62.1% | 4.6%(+57.5)#5 | 4.9%(+57.2)#1,559 |
| 6. | Wells Bridge | 59.1% | 4.6%(+54.5)#6 | 4.9%(+54.2)#1,767 |
| 7. | Portlandville | 57.5% | 4.6%(+52.9)#7 | 4.9%(+52.6)#1,886 |
| 8. | Sleepy Hollow Lake | 56.3% | 4.6%(+51.7)#8 | 4.9%(+51.4)#1,973 |
| 9. | Hall | 53.9% | 4.6%(+49.3)#9 | 4.9%(+49.0)#2,139 |
| 10. | Fishers Landing | 53.6% | 4.6%(+49.0)#10 | 4.9%(+48.7)#2,155 |
| 11. | Laurens | 53.3% | 4.6%(+48.7)#11 | 4.9%(+48.4)#2,177 |
| 12. | Old Forge | 51.9% | 4.6%(+47.3)#12 | 4.9%(+47.0)#2,270 |
| 13. | Tuscarora | 50.8% | 4.6%(+46.2)#13 | 4.9%(+45.9)#2,343 |
| 14. | Cleveland | 49.8% | 4.6%(+45.2)#14 | 4.9%(+44.9)#2,435 |
| 15. | Ovid | 49.5% | 4.6%(+44.9)#15 | 4.9%(+44.6)#2,450 |
| 16. | Speculator | 49.1% | 4.6%(+44.5)#16 | 4.9%(+44.2)#2,476 |
| 17. | Fly Creek | 46.5% | 4.6%(+41.9)#17 | 4.9%(+41.6)#2,692 |
| 18. | Cranberry Lake | 46.2% | 4.6%(+41.6)#18 | 4.9%(+41.3)#2,716 |
| 19. | West Kill | 46.2% | 4.6%(+41.6)#19 | 4.9%(+41.3)#2,720 |
| 20. | Meridian | 45.7% | 4.6%(+41.1)#20 | 4.9%(+40.8)#2,754 |
| 21. | Romulus | 45.2% | 4.6%(+40.6)#21 | 4.9%(+40.3)#2,793 |
| 22. | Sylvan Beach | 44.8% | 4.6%(+40.2)#22 | 4.9%(+39.9)#2,821 |
| 23. | Duane Lake | 44.6% | 4.6%(+40.0)#23 | 4.9%(+39.7)#2,841 |
| 24. | Thendara | 44.0% | 4.6%(+39.4)#24 | 4.9%(+39.1)#2,898 |
| 25. | Linwood | 43.8% | 4.6%(+39.2)#25 | 4.9%(+38.9)#2,916 |
| 26. | Livonia Center | 43.7% | 4.6%(+39.1)#26 | 4.9%(+38.8)#2,920 |
| 27. | Wurtsboro Hills | 42.9% | 4.6%(+38.3)#27 | 4.9%(+38.0)#2,987 |
| 28. | North Bay | 42.7% | 4.6%(+38.1)#28 | 4.9%(+37.8)#3,021 |
| 29. | Caroga Lake | 42.1% | 4.6%(+37.5)#29 | 4.9%(+37.2)#3,062 |
| 30. | Sand Ridge | 41.6% | 4.6%(+37.0)#30 | 4.9%(+36.7)#3,106 |
| 31. | Tannersville | 41.3% | 4.6%(+36.7)#31 | 4.9%(+36.4)#3,118 |
| 32. | Central Bridge | 41.1% | 4.6%(+36.5)#32 | 4.9%(+36.2)#3,137 |
| 33. | Davenport Center | 39.1% | 4.6%(+34.5)#33 | 4.9%(+34.2)#3,312 |
| 34. | Mariaville Lake | 37.5% | 4.6%(+32.9)#34 | 4.9%(+32.6)#3,457 |
| 35. | Lorraine | 37.5% | 4.6%(+32.9)#35 | 4.9%(+32.6)#3,468 |
| 36. | Chaumont | 37.2% | 4.6%(+32.6)#36 | 4.9%(+32.3)#3,495 |
| 37. | Mongaup Valley | 37.1% | 4.6%(+32.5)#37 | 4.9%(+32.2)#3,503 |
| 38. | Smithville Flats | 36.6% | 4.6%(+32.0)#38 | 4.9%(+31.7)#3,544 |
| 39. | Hartwick Seminary | 36.4% | 4.6%(+31.8)#39 | 4.9%(+31.5)#3,561 |
| 40. | Clayton | 35.8% | 4.6%(+31.2)#40 | 4.9%(+30.9)#3,603 |
| 41. | Blodgett Mills | 35.8% | 4.6%(+31.2)#41 | 4.9%(+30.9)#3,608 |
| 42. | Fair Haven | 35.3% | 4.6%(+30.7)#42 | 4.9%(+30.4)#3,646 |
| 43. | Burdett | 34.9% | 4.6%(+30.3)#43 | 4.9%(+30.0)#3,691 |
| 44. | Hemlock | 34.6% | 4.6%(+30.0)#44 | 4.9%(+29.7)#3,718 |
| 45. | Constantia | 34.4% | 4.6%(+29.8)#45 | 4.9%(+29.5)#3,737 |
| 46. | Van Etten | 34.2% | 4.6%(+29.6)#46 | 4.9%(+29.3)#3,758 |
| 47. | Lodi | 33.6% | 4.6%(+29.0)#47 | 4.9%(+28.7)#3,812 |
| 48. | Virgil | 33.3% | 4.6%(+28.7)#48 | 4.9%(+28.4)#3,832 |
| 49. | Parish | 32.7% | 4.6%(+28.1)#49 | 4.9%(+27.8)#3,922 |
| 50. | Copenhagen | 32.4% | 4.6%(+27.8)#50 | 4.9%(+27.5)#3,953 |
| 51. | Riverside | 32.3% | 4.6%(+27.7)#51 | 4.9%(+27.4)#3,960 |
| 52. | Hannawa Falls | 32.2% | 4.6%(+27.6)#52 | 4.9%(+27.3)#3,977 |
| 53. | Pottersville | 32.1% | 4.6%(+27.5)#53 | 4.9%(+27.2)#3,993 |
| 54. | Long Lake | 32.0% | 4.6%(+27.4)#54 | 4.9%(+27.1)#3,999 |
| 55. | Thousand Island Park | 31.8% | 4.6%(+27.2)#55 | 4.9%(+26.9)#4,024 |
| 56. | Sagaponack | 31.7% | 4.6%(+27.1)#56 | 4.9%(+26.8)#4,032 |
| 57. | Cato | 31.1% | 4.6%(+26.5)#57 | 4.9%(+26.2)#4,095 |
| 58. | Galway | 31.1% | 4.6%(+26.5)#58 | 4.9%(+26.2)#4,099 |
| 59. | Durhamville | 30.8% | 4.6%(+26.2)#59 | 4.9%(+25.9)#4,130 |
| 60. | Altmar | 30.7% | 4.6%(+26.1)#60 | 4.9%(+25.8)#4,146 |
| 61. | Rensselaer Falls | 30.6% | 4.6%(+26.0)#61 | 4.9%(+25.7)#4,153 |
| 62. | Amagansett | 30.4% | 4.6%(+25.8)#62 | 4.9%(+25.5)#4,180 |
| 63. | Niverville | 30.3% | 4.6%(+25.7)#63 | 4.9%(+25.4)#4,189 |
| 64. | Schroon Lake | 30.2% | 4.6%(+25.6)#64 | 4.9%(+25.3)#4,201 |
| 65. | Wells | 29.7% | 4.6%(+25.1)#65 | 4.9%(+24.8)#4,258 |
| 66. | Gardiner | 29.6% | 4.6%(+25.0)#66 | 4.9%(+24.7)#4,270 |
| 67. | Rodman | 29.4% | 4.6%(+24.8)#67 | 4.9%(+24.5)#4,301 |
| 68. | East Hampton North | 29.0% | 4.6%(+24.4)#68 | 4.9%(+24.1)#4,347 |
| 69. | Odessa | 28.8% | 4.6%(+24.2)#69 | 4.9%(+23.9)#4,367 |
| 70. | Redwood | 28.8% | 4.6%(+24.2)#70 | 4.9%(+23.9)#4,371 |
| 71. | Websters Crossing | 28.8% | 4.6%(+24.2)#71 | 4.9%(+23.9)#4,375 |
| 72. | South Lima | 28.2% | 4.6%(+23.6)#72 | 4.9%(+23.3)#4,458 |
| 73. | Willsboro Point | 27.8% | 4.6%(+23.2)#73 | 4.9%(+22.9)#4,495 |
| 74. | Woodstock | 27.4% | 4.6%(+22.8)#74 | 4.9%(+22.5)#4,548 |
| 75. | Conesus | 27.4% | 4.6%(+22.8)#75 | 4.9%(+22.5)#4,556 |
| 76. | Port Leyden | 27.1% | 4.6%(+22.5)#76 | 4.9%(+22.2)#4,592 |
| 77. | New Baltimore | 27.1% | 4.6%(+22.5)#77 | 4.9%(+22.2)#4,593 |
| 78. | Burlington Flats | 26.9% | 4.6%(+22.3)#78 | 4.9%(+22.0)#4,624 |
| 79. | Fallsburg | 26.8% | 4.6%(+22.2)#79 | 4.9%(+21.9)#4,631 |
| 80. | Prattsville | 26.4% | 4.6%(+21.8)#80 | 4.9%(+21.5)#4,698 |
| 81. | White Lake | 26.4% | 4.6%(+21.8)#81 | 4.9%(+21.5)#4,699 |
| 82. | Otisville | 26.3% | 4.6%(+21.7)#82 | 4.9%(+21.4)#4,705 |
| 83. | Earlville | 26.1% | 4.6%(+21.5)#83 | 4.9%(+21.2)#4,735 |
| 84. | Marlboro | 26.0% | 4.6%(+21.4)#84 | 4.9%(+21.1)#4,751 |
| 85. | Fleischmanns | 25.7% | 4.6%(+21.1)#85 | 4.9%(+20.8)#4,797 |
| 86. | Canaseraga | 25.6% | 4.6%(+21.0)#86 | 4.9%(+20.7)#4,810 |
| 87. | Munnsville | 24.8% | 4.6%(+20.2)#87 | 4.9%(+19.9)#4,946 |
| 88. | Springwater | 24.7% | 4.6%(+20.1)#88 | 4.9%(+19.8)#4,960 |
| 89. | Ticonderoga | 24.6% | 4.6%(+20.0)#89 | 4.9%(+19.7)#4,967 |
| 90. | Esperance | 24.4% | 4.6%(+19.8)#90 | 4.9%(+19.5)#4,999 |
| 91. | Nassau Lake | 24.3% | 4.6%(+19.7)#91 | 4.9%(+19.4)#5,008 |
| 92. | Eldred | 24.3% | 4.6%(+19.7)#92 | 4.9%(+19.4)#5,018 |
| 93. | Rock Hill | 24.2% | 4.6%(+19.6)#93 | 4.9%(+19.3)#5,021 |
| 94. | Lakeville | 24.1% | 4.6%(+19.5)#94 | 4.9%(+19.2)#5,041 |
| 95. | Camden | 23.8% | 4.6%(+19.2)#95 | 4.9%(+18.9)#5,072 |
| 96. | Fort Ann | 23.8% | 4.6%(+19.2)#96 | 4.9%(+18.9)#5,080 |
| 97. | Schoharie | 23.7% | 4.6%(+19.1)#97 | 4.9%(+18.8)#5,093 |
| 98. | Cape Vincent | 23.7% | 4.6%(+19.1)#98 | 4.9%(+18.8)#5,097 |
| 99. | Duanesburg | 23.7% | 4.6%(+19.1)#99 | 4.9%(+18.8)#5,100 |
| 100. | Northwest Harbor | 23.3% | 4.6%(+18.7)#100 | 4.9%(+18.4)#5,139 |
Common Questions
What are the Top 10 Cities with the Highest Percentage of Households Heated by Bottled Gas / Liquid Propane in New York?
Top 10 Cities with the Highest Percentage of Households Heated by Bottled Gas / Liquid Propane in New York are:
#1
74.2%
#2
66.7%
#3
64.6%
#4
62.1%
#5
53.9%
#6
53.6%
#7
53.3%
#8
51.9%
#9
50.8%
#10
49.8%
What city has the Highest Percentage of Households Heated by Bottled Gas / Liquid Propane in New York?
Three Mile Bay has the Highest Percentage of Households Heated by Bottled Gas / Liquid Propane in New York with 74.2%.
What is the Percentage of Households Heated by Bottled Gas / Liquid Propane in the State of New York?
Percentage of Households Heated by Bottled Gas / Liquid Propane in New York is 4.6%.
What is the Percentage of Households Heated by Bottled Gas / Liquid Propane in the United States?
Percentage of Households Heated by Bottled Gas / Liquid Propane in the United States is 4.9%.