Cities with the Most Immigrants from Haiti in Pennsylvania
RELATED REPORTS & OPTIONS
Haiti
Pennsylvania
Compare Cities
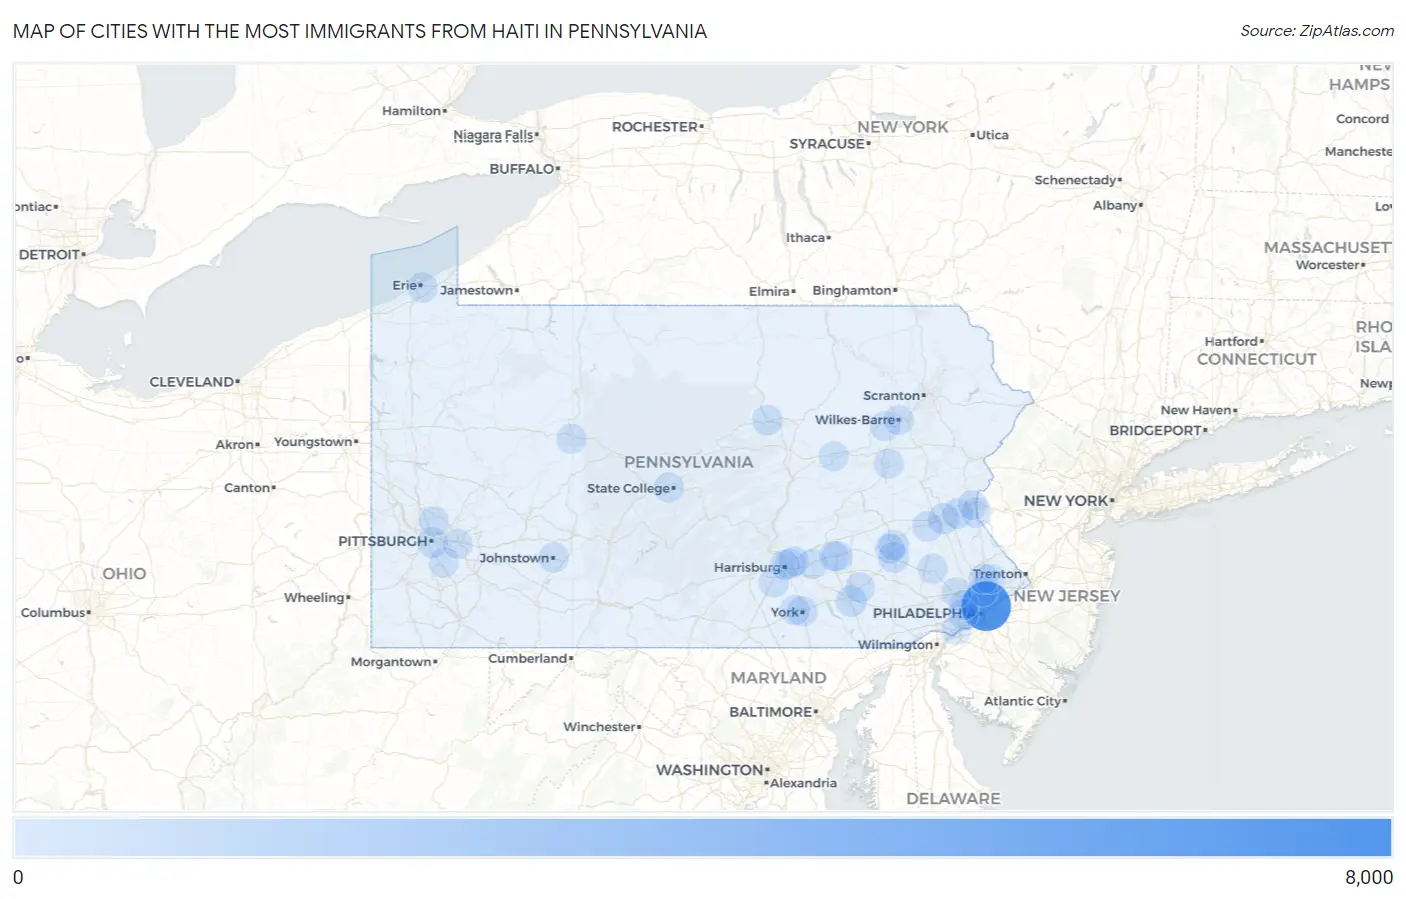
Map of Cities with the Most Immigrants from Haiti in Pennsylvania
0
8,000
Cities with the Most Immigrants from Haiti in Pennsylvania
| City | Haiti | vs State | vs National | |
| 1. | Philadelphia | 6,877 | 15,224(45.17%)#1 | 694,547(0.99%)#15 |
| 2. | Allentown | 356 | 15,224(2.34%)#2 | 694,547(0.05%)#211 |
| 3. | Lancaster | 347 | 15,224(2.28%)#3 | 694,547(0.05%)#217 |
| 4. | Reading | 224 | 15,224(1.47%)#4 | 694,547(0.03%)#288 |
| 5. | Pittsburgh | 211 | 15,224(1.39%)#5 | 694,547(0.03%)#306 |
| 6. | Collingdale Borough | 197 | 15,224(1.29%)#6 | 694,547(0.03%)#323 |
| 7. | Yeadon Borough | 179 | 15,224(1.18%)#7 | 694,547(0.03%)#341 |
| 8. | Elkins Park | 175 | 15,224(1.15%)#8 | 694,547(0.03%)#353 |
| 9. | Bethlehem | 168 | 15,224(1.10%)#9 | 694,547(0.02%)#358 |
| 10. | Trappe Borough | 160 | 15,224(1.05%)#10 | 694,547(0.02%)#372 |
| 11. | Williamsport | 155 | 15,224(1.02%)#11 | 694,547(0.02%)#383 |
| 12. | Breinigsville | 155 | 15,224(1.02%)#12 | 694,547(0.02%)#386 |
| 13. | Lansdowne Borough | 151 | 15,224(0.99%)#13 | 694,547(0.02%)#394 |
| 14. | Darby Borough | 144 | 15,224(0.95%)#14 | 694,547(0.02%)#408 |
| 15. | Raubsville | 114 | 15,224(0.75%)#15 | 694,547(0.02%)#494 |
| 16. | Chambersburg Borough | 106 | 15,224(0.70%)#16 | 694,547(0.02%)#512 |
| 17. | York | 103 | 15,224(0.68%)#17 | 694,547(0.01%)#519 |
| 18. | Temple | 103 | 15,224(0.68%)#18 | 694,547(0.01%)#524 |
| 19. | Lebanon | 102 | 15,224(0.67%)#19 | 694,547(0.01%)#528 |
| 20. | Glenside | 101 | 15,224(0.66%)#20 | 694,547(0.01%)#531 |
| 21. | Brookhaven Borough | 96 | 15,224(0.63%)#21 | 694,547(0.01%)#553 |
| 22. | Shippensburg Borough | 80 | 15,224(0.53%)#22 | 694,547(0.01%)#617 |
| 23. | Penndel Borough | 68 | 15,224(0.45%)#23 | 694,547(0.01%)#682 |
| 24. | Erie | 64 | 15,224(0.42%)#24 | 694,547(0.01%)#696 |
| 25. | Drexel Hill | 61 | 15,224(0.40%)#25 | 694,547(0.01%)#724 |
| 26. | Indiana Borough | 44 | 15,224(0.29%)#26 | 694,547(0.01%)#873 |
| 27. | Progress | 44 | 15,224(0.29%)#27 | 694,547(0.01%)#876 |
| 28. | East Lansdowne Borough | 43 | 15,224(0.28%)#28 | 694,547(0.01%)#886 |
| 29. | Mount Pocono Borough | 41 | 15,224(0.27%)#29 | 694,547(0.01%)#901 |
| 30. | Hershey | 39 | 15,224(0.26%)#30 | 694,547(0.01%)#931 |
| 31. | Clairton | 39 | 15,224(0.26%)#31 | 694,547(0.01%)#936 |
| 32. | Colonial Park | 37 | 15,224(0.24%)#32 | 694,547(0.01%)#952 |
| 33. | Glenolden Borough | 36 | 15,224(0.24%)#33 | 694,547(0.01%)#969 |
| 34. | East Stroudsburg Borough | 35 | 15,224(0.23%)#34 | 694,547(0.01%)#983 |
| 35. | Downingtown Borough | 33 | 15,224(0.22%)#35 | 694,547(0.00%)#1,005 |
| 36. | Chester | 32 | 15,224(0.21%)#36 | 694,547(0.00%)#1,014 |
| 37. | Sanatoga | 32 | 15,224(0.21%)#37 | 694,547(0.00%)#1,018 |
| 38. | Eagleville Cdp Montgomery County | 31 | 15,224(0.20%)#38 | 694,547(0.00%)#1,035 |
| 39. | Warminster Heights | 31 | 15,224(0.20%)#39 | 694,547(0.00%)#1,036 |
| 40. | Cheltenham | 31 | 15,224(0.20%)#40 | 694,547(0.00%)#1,037 |
| 41. | Norristown Borough | 30 | 15,224(0.20%)#41 | 694,547(0.00%)#1,041 |
| 42. | Allison Park | 30 | 15,224(0.20%)#42 | 694,547(0.00%)#1,042 |
| 43. | Nanticoke | 30 | 15,224(0.20%)#43 | 694,547(0.00%)#1,044 |
| 44. | Freemansburg Borough | 29 | 15,224(0.19%)#44 | 694,547(0.00%)#1,059 |
| 45. | Park Forest Village | 25 | 15,224(0.16%)#45 | 694,547(0.00%)#1,129 |
| 46. | Macungie Borough | 24 | 15,224(0.16%)#46 | 694,547(0.00%)#1,146 |
| 47. | St. Davids | 22 | 15,224(0.14%)#47 | 694,547(0.00%)#1,185 |
| 48. | Biglerville Borough | 22 | 15,224(0.14%)#48 | 694,547(0.00%)#1,187 |
| 49. | King Of Prussia | 21 | 15,224(0.14%)#49 | 694,547(0.00%)#1,191 |
| 50. | Cleona Borough | 21 | 15,224(0.14%)#50 | 694,547(0.00%)#1,207 |
| 51. | Monroeville | 20 | 15,224(0.13%)#51 | 694,547(0.00%)#1,215 |
| 52. | Shiloh | 20 | 15,224(0.13%)#52 | 694,547(0.00%)#1,219 |
| 53. | Easton | 17 | 15,224(0.11%)#53 | 694,547(0.00%)#1,287 |
| 54. | Pottstown Borough | 16 | 15,224(0.11%)#54 | 694,547(0.00%)#1,305 |
| 55. | Bellevue Borough | 16 | 15,224(0.11%)#55 | 694,547(0.00%)#1,321 |
| 56. | Lansdale Borough | 15 | 15,224(0.10%)#56 | 694,547(0.00%)#1,350 |
| 57. | Horsham | 15 | 15,224(0.10%)#57 | 694,547(0.00%)#1,352 |
| 58. | Bloomsburg | 15 | 15,224(0.10%)#58 | 694,547(0.00%)#1,356 |
| 59. | Pleasant Hill | 15 | 15,224(0.10%)#59 | 694,547(0.00%)#1,365 |
| 60. | Bowmanstown Borough | 15 | 15,224(0.10%)#60 | 694,547(0.00%)#1,368 |
| 61. | Riverview Park | 14 | 15,224(0.09%)#61 | 694,547(0.00%)#1,392 |
| 62. | Alburtis Borough | 14 | 15,224(0.09%)#62 | 694,547(0.00%)#1,397 |
| 63. | Johnstown | 12 | 15,224(0.08%)#63 | 694,547(0.00%)#1,439 |
| 64. | Palmyra Borough | 12 | 15,224(0.08%)#64 | 694,547(0.00%)#1,451 |
| 65. | Harrisburg | 11 | 15,224(0.07%)#65 | 694,547(0.00%)#1,471 |
| 66. | Dubois | 10 | 15,224(0.07%)#66 | 694,547(0.00%)#1,526 |
| 67. | Aldan Borough | 10 | 15,224(0.07%)#67 | 694,547(0.00%)#1,530 |
| 68. | Green Lane Borough | 10 | 15,224(0.07%)#68 | 694,547(0.00%)#1,542 |
| 69. | Swarthmore Borough | 9 | 15,224(0.06%)#69 | 694,547(0.00%)#1,579 |
| 70. | Brownstown | 9 | 15,224(0.06%)#70 | 694,547(0.00%)#1,580 |
| 71. | Edgewood Borough | 9 | 15,224(0.06%)#71 | 694,547(0.00%)#1,582 |
| 72. | Ashley Borough | 9 | 15,224(0.06%)#72 | 694,547(0.00%)#1,583 |
| 73. | Dravosburg Borough | 8 | 15,224(0.05%)#73 | 694,547(0.00%)#1,620 |
| 74. | Tullytown Borough | 7 | 15,224(0.05%)#74 | 694,547(0.00%)#1,657 |
| 75. | Plum Borough | 6 | 15,224(0.04%)#75 | 694,547(0.00%)#1,676 |
| 76. | Carlisle Borough | 6 | 15,224(0.04%)#76 | 694,547(0.00%)#1,679 |
| 77. | Laureldale Borough | 6 | 15,224(0.04%)#77 | 694,547(0.00%)#1,699 |
| 78. | Akron Borough | 6 | 15,224(0.04%)#78 | 694,547(0.00%)#1,700 |
| 79. | Messiah College | 6 | 15,224(0.04%)#79 | 694,547(0.00%)#1,705 |
| 80. | Southmont Borough | 6 | 15,224(0.04%)#80 | 694,547(0.00%)#1,706 |
| 81. | Haverford College | 5 | 15,224(0.03%)#81 | 694,547(0.00%)#1,739 |
| 82. | Millbourne Borough | 5 | 15,224(0.03%)#82 | 694,547(0.00%)#1,740 |
| 83. | Plymouth Borough | 4 | 15,224(0.03%)#83 | 694,547(0.00%)#1,773 |
| 84. | Hamburg Borough | 4 | 15,224(0.03%)#84 | 694,547(0.00%)#1,775 |
| 85. | St Lawrence Borough | 3 | 15,224(0.02%)#85 | 694,547(0.00%)#1,813 |
| 86. | Bechtelsville Borough | 2 | 15,224(0.01%)#86 | 694,547(0.00%)#1,844 |
| 87. | Meshoppen Borough | 2 | 15,224(0.01%)#87 | 694,547(0.00%)#1,848 |
| 88. | Wilkes Barre | 1 | 15,224(0.01%)#88 | 694,547(0.00%)#1,855 |
| 89. | Hazleton | 1 | 15,224(0.01%)#89 | 694,547(0.00%)#1,859 |
| 90. | Grove City Borough | 1 | 15,224(0.01%)#90 | 694,547(0.00%)#1,874 |
| 91. | Dupont Borough | 1 | 15,224(0.01%)#91 | 694,547(0.00%)#1,885 |
| 92. | Laflin Borough | 1 | 15,224(0.01%)#92 | 694,547(0.00%)#1,887 |
Common Questions
What are the Top 10 Cities with the Most Immigrants from Haiti in Pennsylvania?
Top 10 Cities with the Most Immigrants from Haiti in Pennsylvania are:
#1
6,877
#2
356
#3
347
#4
224
#5
211
#6
168
#7
155
#8
155
#9
114
#10
103
What city has the Most Immigrants from Haiti in Pennsylvania?
Philadelphia has the Most Immigrants from Haiti in Pennsylvania with 6,877.
What is the Total Immigrants from Haiti in the State of Pennsylvania?
Total Immigrants from Haiti in Pennsylvania is 15,224.
What is the Total Immigrants from Haiti in the United States?
Total Immigrants from Haiti in the United States is 694,547.