Cities with the Largest Danish Community in Michigan
RELATED REPORTS & OPTIONS
Danish
Michigan
Compare Cities
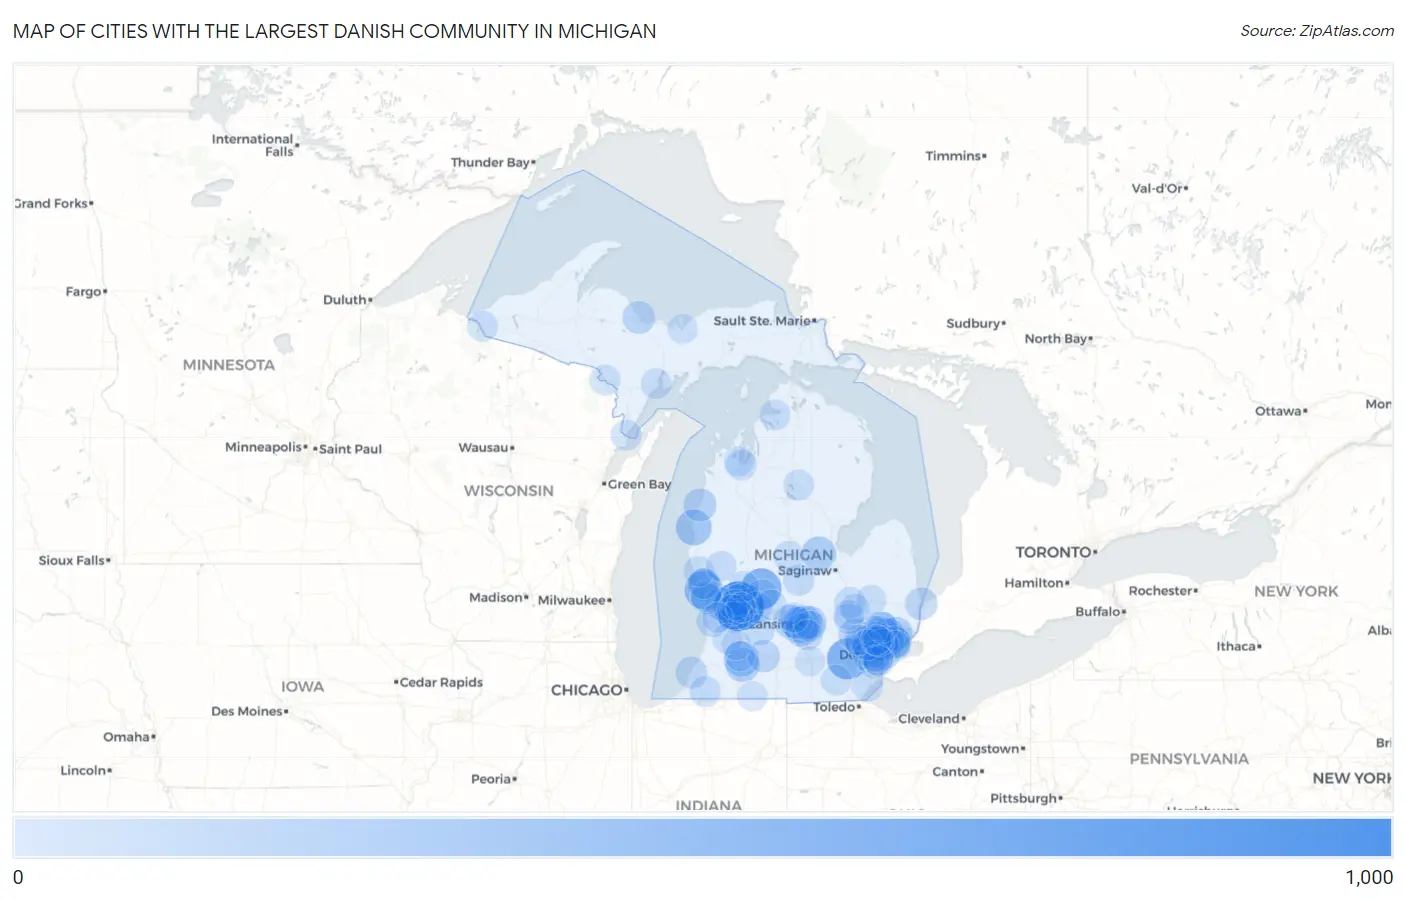
Map of Cities with the Largest Danish Community in Michigan
0
1,000
Cities with the Largest Danish Community in Michigan
| City | Danish | vs State | vs National | |
| 1. | Grand Rapids | 909 | 33,960(2.68%)#1 | 1,182,895(0.08%)#154 |
| 2. | Ann Arbor | 518 | 33,960(1.53%)#2 | 1,182,895(0.04%)#309 |
| 3. | Greenville | 499 | 33,960(1.47%)#3 | 1,182,895(0.04%)#320 |
| 4. | Norton Shores | 402 | 33,960(1.18%)#4 | 1,182,895(0.03%)#425 |
| 5. | Wyoming | 354 | 33,960(1.04%)#5 | 1,182,895(0.03%)#486 |
| 6. | Lansing | 293 | 33,960(0.86%)#6 | 1,182,895(0.02%)#613 |
| 7. | Ludington | 292 | 33,960(0.86%)#7 | 1,182,895(0.02%)#617 |
| 8. | Troy | 274 | 33,960(0.81%)#8 | 1,182,895(0.02%)#663 |
| 9. | Kalamazoo | 261 | 33,960(0.77%)#9 | 1,182,895(0.02%)#706 |
| 10. | Forest Hills | 240 | 33,960(0.71%)#10 | 1,182,895(0.02%)#753 |
| 11. | Southfield | 231 | 33,960(0.68%)#11 | 1,182,895(0.02%)#783 |
| 12. | Midland | 230 | 33,960(0.68%)#12 | 1,182,895(0.02%)#787 |
| 13. | Rochester Hills | 229 | 33,960(0.67%)#13 | 1,182,895(0.02%)#791 |
| 14. | Roseville | 225 | 33,960(0.66%)#14 | 1,182,895(0.02%)#804 |
| 15. | Farmington Hills | 224 | 33,960(0.66%)#15 | 1,182,895(0.02%)#806 |
| 16. | Sterling Heights | 218 | 33,960(0.64%)#16 | 1,182,895(0.02%)#827 |
| 17. | East Lansing | 214 | 33,960(0.63%)#17 | 1,182,895(0.02%)#841 |
| 18. | Royal Oak | 212 | 33,960(0.62%)#18 | 1,182,895(0.02%)#859 |
| 19. | Portage | 209 | 33,960(0.62%)#19 | 1,182,895(0.02%)#874 |
| 20. | Northview | 202 | 33,960(0.59%)#20 | 1,182,895(0.02%)#900 |
| 21. | Livonia | 191 | 33,960(0.56%)#21 | 1,182,895(0.02%)#960 |
| 22. | Detroit | 189 | 33,960(0.56%)#22 | 1,182,895(0.02%)#969 |
| 23. | Muskegon | 189 | 33,960(0.56%)#23 | 1,182,895(0.02%)#972 |
| 24. | Mount Clemens | 189 | 33,960(0.56%)#24 | 1,182,895(0.02%)#974 |
| 25. | Grand Ledge | 189 | 33,960(0.56%)#25 | 1,182,895(0.02%)#975 |
| 26. | Kentwood | 172 | 33,960(0.51%)#26 | 1,182,895(0.01%)#1,094 |
| 27. | Holt | 165 | 33,960(0.49%)#27 | 1,182,895(0.01%)#1,137 |
| 28. | Allendale | 164 | 33,960(0.48%)#28 | 1,182,895(0.01%)#1,144 |
| 29. | Manistee | 164 | 33,960(0.48%)#29 | 1,182,895(0.01%)#1,147 |
| 30. | Haslett | 156 | 33,960(0.46%)#30 | 1,182,895(0.01%)#1,184 |
| 31. | Milford | 156 | 33,960(0.46%)#31 | 1,182,895(0.01%)#1,185 |
| 32. | Warren | 148 | 33,960(0.44%)#32 | 1,182,895(0.01%)#1,238 |
| 33. | Marquette | 146 | 33,960(0.43%)#33 | 1,182,895(0.01%)#1,255 |
| 34. | Port Huron | 141 | 33,960(0.42%)#34 | 1,182,895(0.01%)#1,291 |
| 35. | St Clair Shores | 140 | 33,960(0.41%)#35 | 1,182,895(0.01%)#1,301 |
| 36. | Waverly | 140 | 33,960(0.41%)#36 | 1,182,895(0.01%)#1,307 |
| 37. | Ferndale | 136 | 33,960(0.40%)#37 | 1,182,895(0.01%)#1,346 |
| 38. | Battle Creek | 133 | 33,960(0.39%)#38 | 1,182,895(0.01%)#1,368 |
| 39. | Dearborn | 125 | 33,960(0.37%)#39 | 1,182,895(0.01%)#1,439 |
| 40. | St Joseph | 114 | 33,960(0.34%)#40 | 1,182,895(0.01%)#1,566 |
| 41. | Novi | 113 | 33,960(0.33%)#41 | 1,182,895(0.01%)#1,570 |
| 42. | Holland | 113 | 33,960(0.33%)#42 | 1,182,895(0.01%)#1,575 |
| 43. | Lowell | 110 | 33,960(0.32%)#43 | 1,182,895(0.01%)#1,618 |
| 44. | Cutlerville | 108 | 33,960(0.32%)#44 | 1,182,895(0.01%)#1,643 |
| 45. | Westland | 107 | 33,960(0.32%)#45 | 1,182,895(0.01%)#1,649 |
| 46. | Hastings | 99 | 33,960(0.29%)#46 | 1,182,895(0.01%)#1,777 |
| 47. | Birmingham | 95 | 33,960(0.28%)#47 | 1,182,895(0.01%)#1,840 |
| 48. | Ithaca | 91 | 33,960(0.27%)#48 | 1,182,895(0.01%)#1,903 |
| 49. | Grand Haven | 86 | 33,960(0.25%)#49 | 1,182,895(0.01%)#1,989 |
| 50. | Ferrysburg | 84 | 33,960(0.25%)#50 | 1,182,895(0.01%)#2,037 |
| 51. | Comstock Park | 82 | 33,960(0.24%)#51 | 1,182,895(0.01%)#2,065 |
| 52. | Belding | 82 | 33,960(0.24%)#52 | 1,182,895(0.01%)#2,071 |
| 53. | Byron Center | 78 | 33,960(0.23%)#53 | 1,182,895(0.01%)#2,150 |
| 54. | Flint | 76 | 33,960(0.22%)#54 | 1,182,895(0.01%)#2,178 |
| 55. | Niles | 76 | 33,960(0.22%)#55 | 1,182,895(0.01%)#2,187 |
| 56. | Grosse Pointe Woods | 75 | 33,960(0.22%)#56 | 1,182,895(0.01%)#2,210 |
| 57. | Taylor | 73 | 33,960(0.21%)#57 | 1,182,895(0.01%)#2,257 |
| 58. | Escanaba | 72 | 33,960(0.21%)#58 | 1,182,895(0.01%)#2,289 |
| 59. | Petoskey | 72 | 33,960(0.21%)#59 | 1,182,895(0.01%)#2,295 |
| 60. | Dearborn Heights | 71 | 33,960(0.21%)#60 | 1,182,895(0.01%)#2,301 |
| 61. | Mount Pleasant | 71 | 33,960(0.21%)#61 | 1,182,895(0.01%)#2,306 |
| 62. | Monroe | 71 | 33,960(0.21%)#62 | 1,182,895(0.01%)#2,307 |
| 63. | Traverse City | 71 | 33,960(0.21%)#63 | 1,182,895(0.01%)#2,312 |
| 64. | Tecumseh | 71 | 33,960(0.21%)#64 | 1,182,895(0.01%)#2,314 |
| 65. | Menominee | 68 | 33,960(0.20%)#65 | 1,182,895(0.01%)#2,398 |
| 66. | Whitehall | 68 | 33,960(0.20%)#66 | 1,182,895(0.01%)#2,404 |
| 67. | Walker | 67 | 33,960(0.20%)#67 | 1,182,895(0.01%)#2,411 |
| 68. | Okemos | 66 | 33,960(0.19%)#68 | 1,182,895(0.01%)#2,445 |
| 69. | Quinnesec | 65 | 33,960(0.19%)#69 | 1,182,895(0.01%)#2,501 |
| 70. | Ironwood | 64 | 33,960(0.19%)#70 | 1,182,895(0.01%)#2,523 |
| 71. | North Muskegon | 64 | 33,960(0.19%)#71 | 1,182,895(0.01%)#2,525 |
| 72. | Cedar Springs | 63 | 33,960(0.19%)#72 | 1,182,895(0.01%)#2,555 |
| 73. | Roscommon | 62 | 33,960(0.18%)#73 | 1,182,895(0.01%)#2,587 |
| 74. | Pontiac | 61 | 33,960(0.18%)#74 | 1,182,895(0.01%)#2,591 |
| 75. | Fremont | 61 | 33,960(0.18%)#75 | 1,182,895(0.01%)#2,614 |
| 76. | Ionia | 60 | 33,960(0.18%)#76 | 1,182,895(0.01%)#2,638 |
| 77. | Farmington | 60 | 33,960(0.18%)#77 | 1,182,895(0.01%)#2,640 |
| 78. | Mason | 60 | 33,960(0.18%)#78 | 1,182,895(0.01%)#2,644 |
| 79. | Grandville | 58 | 33,960(0.17%)#79 | 1,182,895(0.00%)#2,706 |
| 80. | Trufant | 58 | 33,960(0.17%)#80 | 1,182,895(0.00%)#2,731 |
| 81. | Allegan | 56 | 33,960(0.16%)#81 | 1,182,895(0.00%)#2,791 |
| 82. | Wixom | 53 | 33,960(0.16%)#82 | 1,182,895(0.00%)#2,873 |
| 83. | Rochester | 53 | 33,960(0.16%)#83 | 1,182,895(0.00%)#2,875 |
| 84. | Allen Park | 51 | 33,960(0.15%)#84 | 1,182,895(0.00%)#2,947 |
| 85. | Fenton | 50 | 33,960(0.15%)#85 | 1,182,895(0.00%)#2,994 |
| 86. | Lincoln Park | 48 | 33,960(0.14%)#86 | 1,182,895(0.00%)#3,058 |
| 87. | Lapeer | 48 | 33,960(0.14%)#87 | 1,182,895(0.00%)#3,070 |
| 88. | Berkley | 47 | 33,960(0.14%)#88 | 1,182,895(0.00%)#3,102 |
| 89. | Lake Fenton | 46 | 33,960(0.14%)#89 | 1,182,895(0.00%)#3,158 |
| 90. | Zeeland | 46 | 33,960(0.14%)#90 | 1,182,895(0.00%)#3,159 |
| 91. | East Grand Rapids | 45 | 33,960(0.13%)#91 | 1,182,895(0.00%)#3,197 |
| 92. | Beverly Hills | 44 | 33,960(0.13%)#92 | 1,182,895(0.00%)#3,254 |
| 93. | Sturgis | 42 | 33,960(0.12%)#93 | 1,182,895(0.00%)#3,344 |
| 94. | Westwood | 42 | 33,960(0.12%)#94 | 1,182,895(0.00%)#3,348 |
| 95. | Greilickville | 42 | 33,960(0.12%)#95 | 1,182,895(0.00%)#3,379 |
| 96. | Munising | 41 | 33,960(0.12%)#96 | 1,182,895(0.00%)#3,423 |
| 97. | Grand Blanc | 39 | 33,960(0.11%)#97 | 1,182,895(0.00%)#3,515 |
| 98. | Otsego | 39 | 33,960(0.11%)#98 | 1,182,895(0.00%)#3,530 |
| 99. | Jackson | 38 | 33,960(0.11%)#99 | 1,182,895(0.00%)#3,563 |
| 100. | Wacousta | 38 | 33,960(0.11%)#100 | 1,182,895(0.00%)#3,608 |
Common Questions
What are the Top 10 Cities with the Largest Danish Community in Michigan?
Top 10 Cities with the Largest Danish Community in Michigan are:
#1
909
#2
518
#3
499
#4
402
#5
354
#6
293
#7
292
#8
274
#9
261
#10
240
What city has the Largest Danish Community in Michigan?
Grand Rapids has the Largest Danish Community in Michigan with 909.
What is the Total Danish Population in the State of Michigan?
Total Danish Population in Michigan is 33,960.
What is the Total Danish Population in the United States?
Total Danish Population in the United States is 1,182,895.